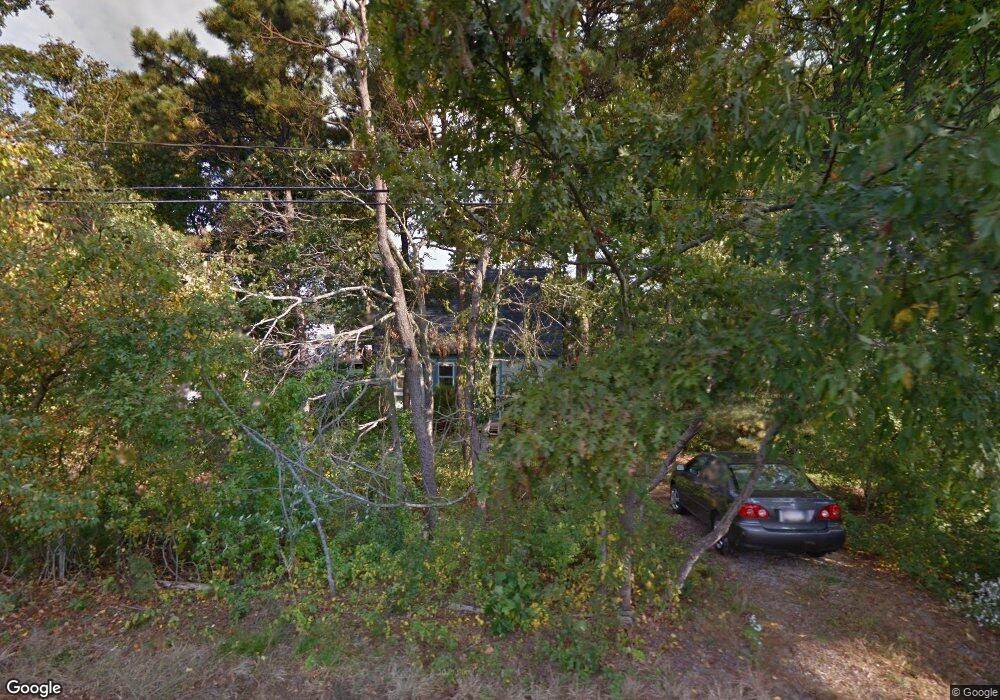
17 Summer St Wareham, MA 02571
Estimated Value: $409,000 - $471,000
3
Beds
2
Baths
936
Sq Ft
$474/Sq Ft
Est. Value
About This Home
This home is located at 17 Summer St, Wareham, MA 02571 and is currently estimated at $443,688, approximately $474 per square foot. 17 Summer St is a home located in Plymouth County.
Ownership History
Date
Name
Owned For
Owner Type
Purchase Details
Closed on
Oct 16, 1991
Sold by
Massachusetts Coop Bk
Bought by
Robinson Jon C and Robinson Pamela G
Current Estimated Value
Home Financials for this Owner
Home Financials are based on the most recent Mortgage that was taken out on this home.
Original Mortgage
$95,392
Interest Rate
9.06%
Mortgage Type
Purchase Money Mortgage
Purchase Details
Closed on
Oct 4, 1991
Sold by
Nolan Paul E
Bought by
Massachusetts Coop Bk
Home Financials for this Owner
Home Financials are based on the most recent Mortgage that was taken out on this home.
Original Mortgage
$95,392
Interest Rate
9.06%
Mortgage Type
Purchase Money Mortgage
Purchase Details
Closed on
Jun 1, 1988
Sold by
Plymouth Bay Rt 18
Bought by
Nolan Paul E
Create a Home Valuation Report for This Property
The Home Valuation Report is an in-depth analysis detailing your home's value as well as a comparison with similar homes in the area
Purchase History
| Date | Buyer | Sale Price | Title Company |
|---|---|---|---|
| Robinson Jon C | $95,392 | -- | |
| Robinson Jon C | $95,392 | -- | |
| Massachusetts Coop Bk | $83,300 | -- | |
| Massachusetts Coop Bk | $83,300 | -- | |
| Nolan Paul E | $119,900 | -- |
Source: Public Records
Mortgage History
| Date | Status | Borrower | Loan Amount |
|---|---|---|---|
| Open | Nolan Paul E | $65,000 | |
| Closed | Nolan Paul E | $95,392 |
Source: Public Records
Tax History
| Year | Tax Paid | Tax Assessment Tax Assessment Total Assessment is a certain percentage of the fair market value that is determined by local assessors to be the total taxable value of land and additions on the property. | Land | Improvement |
|---|---|---|---|---|
| 2025 | $3,655 | $350,800 | $120,800 | $230,000 |
| 2024 | $3,667 | $326,500 | $94,400 | $232,100 |
| 2023 | $3,255 | $290,100 | $85,800 | $204,300 |
| 2022 | $3,255 | $247,000 | $85,800 | $161,200 |
| 2021 | $3,220 | $239,400 | $85,800 | $153,600 |
| 2020 | $3,074 | $231,800 | $85,800 | $146,000 |
| 2019 | $3,138 | $236,100 | $82,500 | $153,600 |
| 2018 | $2,913 | $213,700 | $82,500 | $131,200 |
| 2017 | $2,799 | $208,100 | $82,500 | $125,600 |
| 2016 | $2,665 | $197,000 | $79,800 | $117,200 |
| 2015 | $2,575 | $197,000 | $79,800 | $117,200 |
| 2014 | $2,406 | $187,200 | $79,800 | $107,400 |
Source: Public Records
Map
Nearby Homes
- 2711 Cranberry Hwy
- 2697 Cranberry Hwy Unit 21
- 2743 Cranberry Hwy Unit 5D
- 2645 Cranberry Hwy Unit A
- 156 Sandwich Rd
- 0 Charge Pond Rd
- 110 Mayflower Ridge Dr
- 2838 Cranberry Hwy
- 102 Maple Springs Rd
- 10 Oak St
- 91 Agawam Lake Shore Dr
- 437 Main St
- 9 Old Glen Charlie Rd
- 124 Minot Ave Unit 1
- 7 Knowles Ave
- 223 Charge Pond Rd
- 3 Michael Dr
- 7 Cranberry Ln
- 10 Jonathan Ln
- 106 Circuit Ave
Your Personal Tour Guide
Ask me questions while you tour the home.