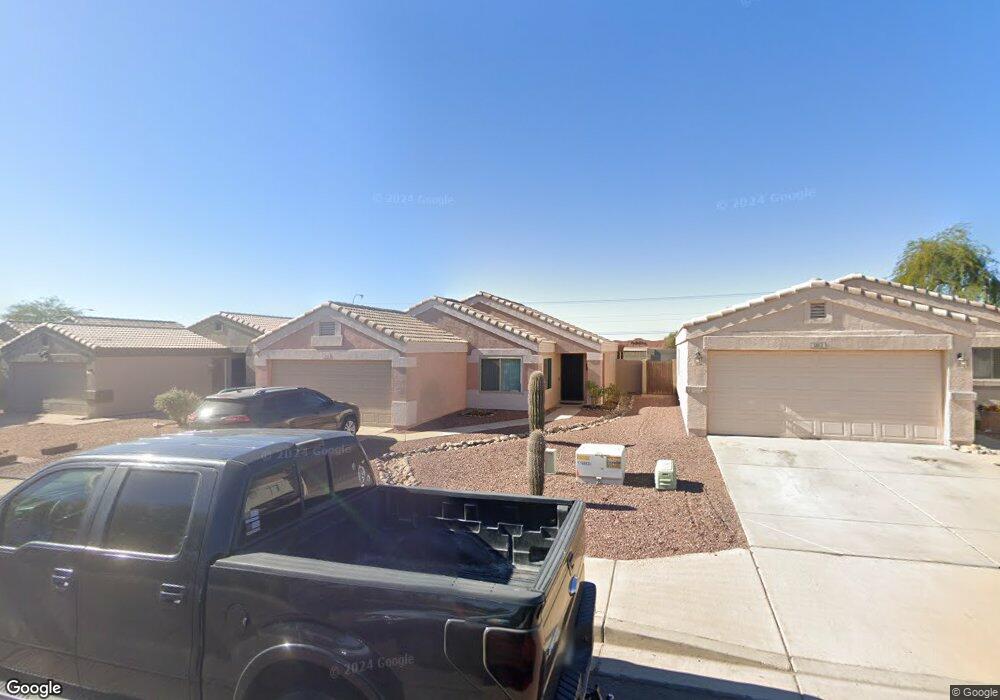
1826 S Pinto Dr Apache Junction, AZ 85120
Estimated Value: $311,552 - $359,000
3
Beds
2
Baths
1,264
Sq Ft
$274/Sq Ft
Est. Value
About This Home
This home is located at 1826 S Pinto Dr, Apache Junction, AZ 85120 and is currently estimated at $345,888, approximately $273 per square foot. 1826 S Pinto Dr is a home located in Pinal County with nearby schools including Desert Vista Elementary School, Cactus Canyon Junior High School, and Apache Junction High School.
Ownership History
Date
Name
Owned For
Owner Type
Purchase Details
Closed on
Jun 22, 2010
Sold by
Morris Troy Allen and Koroleva Evguenia
Bought by
Morris Troy A and Koroleva Evguenia V
Current Estimated Value
Purchase Details
Closed on
Nov 18, 2004
Sold by
Harper Charles K and Harper Theresa
Bought by
Morris Troy Allen and Koroleva Evgenia
Home Financials for this Owner
Home Financials are based on the most recent Mortgage that was taken out on this home.
Original Mortgage
$145,000
Outstanding Balance
$72,070
Interest Rate
5.72%
Mortgage Type
New Conventional
Estimated Equity
$273,818
Purchase Details
Closed on
Dec 9, 1999
Sold by
Diamond Key Homes Inc
Bought by
Harper Charles K and Harper Theresa
Home Financials for this Owner
Home Financials are based on the most recent Mortgage that was taken out on this home.
Original Mortgage
$102,387
Interest Rate
7.96%
Mortgage Type
FHA
Create a Home Valuation Report for This Property
The Home Valuation Report is an in-depth analysis detailing your home's value as well as a comparison with similar homes in the area
Home Values in the Area
Average Home Value in this Area
Purchase History
| Date | Buyer | Sale Price | Title Company |
|---|---|---|---|
| Morris Troy A | -- | None Available | |
| Morris Troy Allen | $145,000 | Chicago Title Insurance Co | |
| Harper Charles K | $103,740 | -- |
Source: Public Records
Mortgage History
| Date | Status | Borrower | Loan Amount |
|---|---|---|---|
| Open | Morris Troy Allen | $145,000 | |
| Previous Owner | Harper Charles K | $102,387 |
Source: Public Records
Tax History
| Year | Tax Paid | Tax Assessment Tax Assessment Total Assessment is a certain percentage of the fair market value that is determined by local assessors to be the total taxable value of land and additions on the property. | Land | Improvement |
|---|---|---|---|---|
| 2025 | $1,276 | $26,014 | -- | -- |
| 2024 | $1,204 | $27,602 | -- | -- |
| 2023 | $1,258 | $21,585 | $2,228 | $19,357 |
| 2022 | $1,204 | $16,415 | $2,228 | $14,187 |
| 2021 | $1,236 | $14,772 | $0 | $0 |
| 2020 | $1,206 | $14,201 | $0 | $0 |
| 2019 | $1,232 | $13,482 | $0 | $0 |
| 2018 | $1,210 | $11,184 | $0 | $0 |
| 2017 | $1,234 | $10,648 | $0 | $0 |
| 2016 | $1,188 | $10,603 | $1,100 | $9,503 |
Source: Public Records
Map
Nearby Homes
- 1840 S Pinto Dr
- 1428 W Mesquite Ave
- 1294 W Mesquite Ave
- 1825 W Renaissance Ave
- 2037 S Saguaro Dr
- 1240 W Diamond Ave
- 1841 W 20th Ave
- 1925 S Palo Verde Dr
- 10281 S Corona Dr
- 1903 W 21st Ave
- 1922 S Palo Verde Dr
- 1921 W 22nd Ave
- 1863 W 23rd Ave
- 1879 W 14th Ave
- 1745 W 13th Ave
- 1694 W 13th Ave
- 3289 W Spaulding Ave
- 1379 S Main Dr
- 1881 W 12th Ave
- 1409 S Ocotillo Dr
- 1812 S Pinto Dr
- 1802 S Pinto Dr
- 1854 S Pinto Dr
- 1868 S Pinto Dr
- 1523 W Mesquite Ave
- 1518 W Mesquite Ave
- 1882 S Pinto Dr
- 1496 W Mesquite Ave
- 1516 W 19th Ave
- 1758 S Pinto Dr
- 1896 S Pinto Dr
- 1493 W Mesquite Ave
- 1521 W 18th Ave
- 1521 W 000018th Ave
- 1504 W 19th Ave
- 1488 W Mesquite Ave
- 1744 S Pinto Dr
- 1505 W 18th Ave
- 1479 W Mesquite Ave
- 1490 W 19th Ave
Your Personal Tour Guide
Ask me questions while you tour the home.