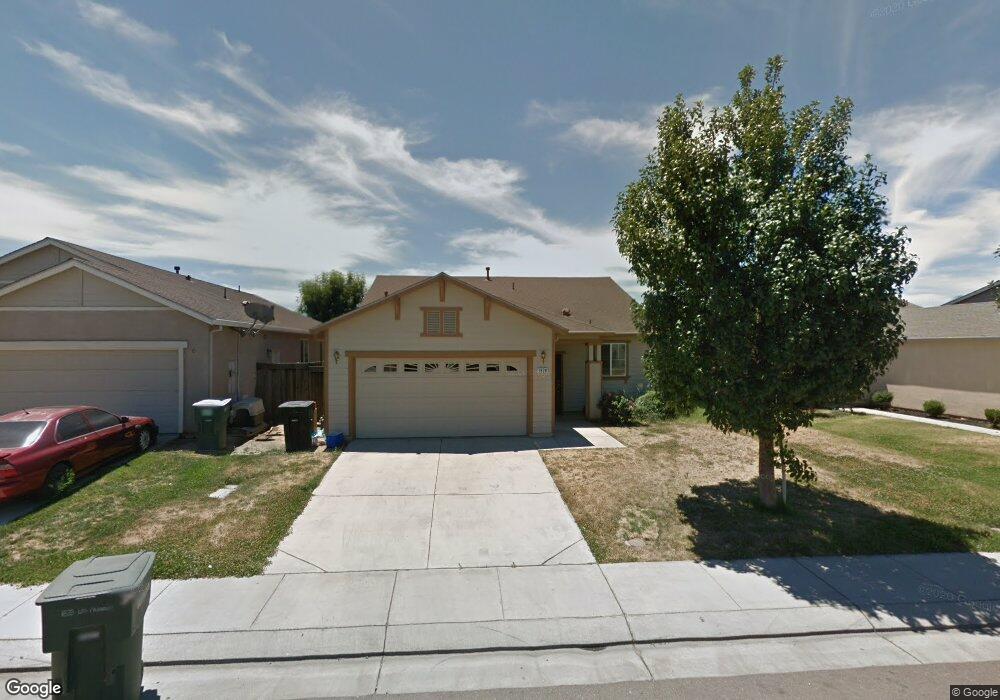
1828 Los Pajaros Way Modesto, CA 95358
Estimated Value: $357,000 - $442,000
4
Beds
2
Baths
1,402
Sq Ft
$291/Sq Ft
Est. Value
About This Home
This home is located at 1828 Los Pajaros Way, Modesto, CA 95358 and is currently estimated at $407,738, approximately $290 per square foot. 1828 Los Pajaros Way is a home located in Stanislaus County with nearby schools including Fairview Elementary School, Evelyn Hanshaw Middle School, and Thomas Downey High School.
Ownership History
Date
Name
Owned For
Owner Type
Purchase Details
Closed on
Oct 16, 2024
Sold by
Hothi Raj Paul and Hothi Chandanjit K
Bought by
Hothi Family Trust and Hothi
Current Estimated Value
Purchase Details
Closed on
Oct 20, 2010
Sold by
Singh Darshan
Bought by
Hothi Raj Paul and Hothi Chandanjit K
Home Financials for this Owner
Home Financials are based on the most recent Mortgage that was taken out on this home.
Original Mortgage
$86,250
Interest Rate
4.31%
Mortgage Type
New Conventional
Purchase Details
Closed on
Apr 5, 2007
Sold by
Del Valle Capital Corp Inc
Bought by
Singh Darshan and Kaur Malkit
Home Financials for this Owner
Home Financials are based on the most recent Mortgage that was taken out on this home.
Original Mortgage
$238,400
Interest Rate
6.11%
Mortgage Type
New Conventional
Create a Home Valuation Report for This Property
The Home Valuation Report is an in-depth analysis detailing your home's value as well as a comparison with similar homes in the area
Home Values in the Area
Average Home Value in this Area
Purchase History
| Date | Buyer | Sale Price | Title Company |
|---|---|---|---|
| Hothi Family Trust | -- | None Listed On Document | |
| Hothi Raj Paul | $115,000 | Commerce Title Company | |
| Singh Darshan | $298,000 | Chicago Title Co |
Source: Public Records
Mortgage History
| Date | Status | Borrower | Loan Amount |
|---|---|---|---|
| Previous Owner | Hothi Raj Paul | $86,250 | |
| Previous Owner | Singh Darshan | $238,400 |
Source: Public Records
Tax History Compared to Growth
Tax History
| Year | Tax Paid | Tax Assessment Tax Assessment Total Assessment is a certain percentage of the fair market value that is determined by local assessors to be the total taxable value of land and additions on the property. | Land | Improvement |
|---|---|---|---|---|
| 2025 | $3,386 | $147,324 | $38,430 | $108,894 |
| 2024 | $3,308 | $144,436 | $37,677 | $106,759 |
| 2023 | $3,171 | $141,605 | $36,939 | $104,666 |
| 2022 | $3,053 | $138,829 | $36,215 | $102,614 |
| 2021 | $2,868 | $136,107 | $35,505 | $100,602 |
| 2020 | $2,884 | $134,712 | $35,141 | $99,571 |
| 2019 | $2,783 | $132,071 | $34,452 | $97,619 |
| 2018 | $2,712 | $129,482 | $33,777 | $95,705 |
| 2017 | $2,554 | $126,944 | $33,115 | $93,829 |
| 2016 | $1,792 | $124,456 | $32,466 | $91,990 |
| 2015 | $2,519 | $122,588 | $31,979 | $90,609 |
| 2014 | $2,626 | $120,188 | $31,353 | $88,835 |
Source: Public Records
Map
Nearby Homes
- 1932 San Ramos Way
- 1801 W Hatch Rd
- 1700 St Charlotte Ln
- 1541 W Hatch Rd
- 1537 W Hatch Rd
- 1733 Walpole Dr
- 1827 John St
- 1805 Kenneth St
- 1948 Boise Ave
- 1501 W Whitmore Ave
- 1116 Pine Meadow Ct
- 1300 Cribari Dr
- 925 Stone Pine Way
- 2104 Olive Branch Dr
- 732 Bristlecone Way
- 828 Clementa Way
- 704 Glenn Ave
- 816 Clementa Way
- 812 Clementa Way
- 1546 Kazmir Ct
- 1824 Los Pajaros Way
- 1832 Los Pajaros Way
- 1825 Cielito Dr
- 1820 Los Pajaros Way
- 1836 Los Pajaros Way
- 1829 Cielito Dr
- 1821 Cielito Dr
- 1833 Cielito Dr
- 1817 Cielito Dr
- 1829 Los Pajaros Way
- 1816 Los Pajaros Way
- 1825 Los Pajaros Way
- 1840 Los Pajaros Way
- 1833 Los Pajaros Way
- 1821 Los Pajaros Way
- 1837 Los Pajaros Way
- 1813 Cielito Dr
- 1837 Cielito Dr
- 1812 Los Pajaros Way
- 1817 Los Pajaros Way