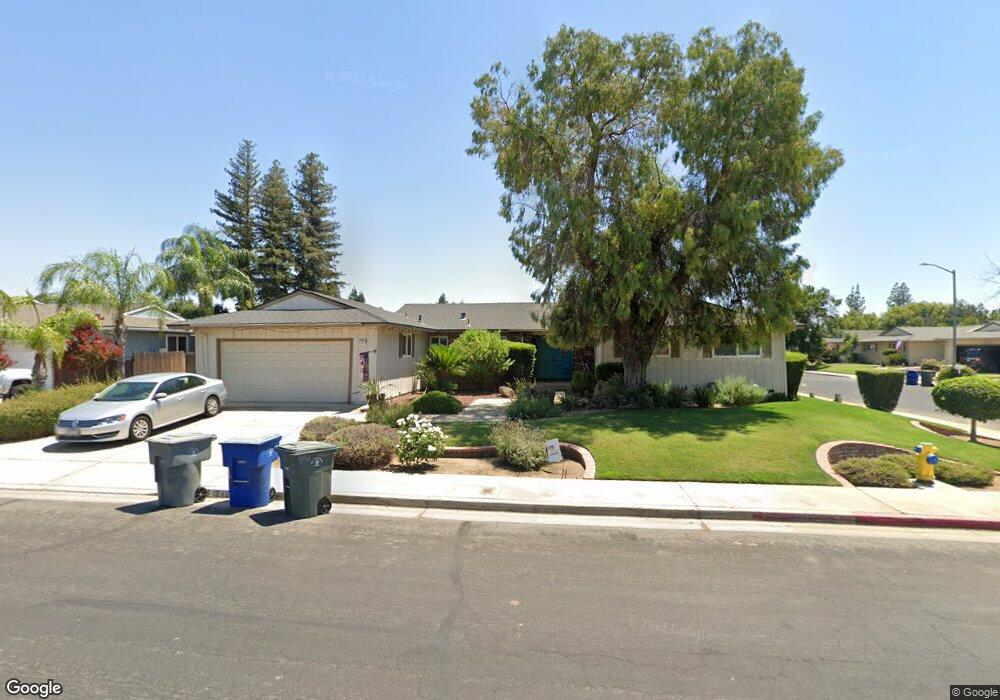
1846 Mitchell Ave Clovis, CA 93611
Estimated Value: $461,075 - $483,000
3
Beds
2
Baths
1,795
Sq Ft
$265/Sq Ft
Est. Value
About This Home
This home is located at 1846 Mitchell Ave, Clovis, CA 93611 and is currently estimated at $475,358, approximately $264 per square foot. 1846 Mitchell Ave is a home located in Fresno County with nearby schools including Clovis Elementary School, Clark Intermediate School, and Clovis High School.
Ownership History
Date
Name
Owned For
Owner Type
Purchase Details
Closed on
Sep 24, 2002
Sold by
Felker Darrell Edwin and Felker Barbara Jean
Bought by
Alvarez Freddy E and Alvarez Helia A
Current Estimated Value
Home Financials for this Owner
Home Financials are based on the most recent Mortgage that was taken out on this home.
Original Mortgage
$172,000
Outstanding Balance
$71,063
Interest Rate
6.09%
Estimated Equity
$404,295
Purchase Details
Closed on
Apr 3, 1997
Sold by
Veterans Welfare Board State Of Ca
Bought by
Kandarian Ernest
Home Financials for this Owner
Home Financials are based on the most recent Mortgage that was taken out on this home.
Original Mortgage
$74,000
Interest Rate
7.35%
Purchase Details
Closed on
Apr 1, 1997
Sold by
Ernest Kandarian
Bought by
Felker Darrell Edwin and Felker Barbara Jean
Home Financials for this Owner
Home Financials are based on the most recent Mortgage that was taken out on this home.
Original Mortgage
$74,000
Interest Rate
7.35%
Create a Home Valuation Report for This Property
The Home Valuation Report is an in-depth analysis detailing your home's value as well as a comparison with similar homes in the area
Home Values in the Area
Average Home Value in this Area
Purchase History
| Date | Buyer | Sale Price | Title Company |
|---|---|---|---|
| Alvarez Freddy E | $215,000 | Financial Title Company | |
| Kandarian Ernest | -- | First American Title Ins Co | |
| Felker Darrell Edwin | $124,000 | First American Title Ins Co |
Source: Public Records
Mortgage History
| Date | Status | Borrower | Loan Amount |
|---|---|---|---|
| Open | Alvarez Freddy E | $172,000 | |
| Previous Owner | Felker Darrell Edwin | $74,000 |
Source: Public Records
Tax History
| Year | Tax Paid | Tax Assessment Tax Assessment Total Assessment is a certain percentage of the fair market value that is determined by local assessors to be the total taxable value of land and additions on the property. | Land | Improvement |
|---|---|---|---|---|
| 2025 | $3,680 | $311,368 | $68,060 | $243,308 |
| 2023 | $3,541 | $299,279 | $65,418 | $233,861 |
| 2022 | $3,494 | $293,412 | $64,136 | $229,276 |
| 2021 | $3,396 | $287,660 | $62,879 | $224,781 |
| 2020 | $3,383 | $284,712 | $62,235 | $222,477 |
| 2019 | $3,317 | $279,130 | $61,015 | $218,115 |
| 2018 | $3,245 | $273,658 | $59,819 | $213,839 |
| 2017 | $3,190 | $268,294 | $58,647 | $209,647 |
| 2016 | $2,988 | $255,000 | $80,000 | $175,000 |
| 2015 | $2,793 | $238,300 | $61,300 | $177,000 |
| 2014 | $2,620 | $223,200 | $57,400 | $165,800 |
Source: Public Records
Map
Nearby Homes
- 1334 Shirley Ave
- 1876 Cougar Ln
- 1721 Beverly Ave
- 1273 Bundy Ave
- 1895 Dennis Ave
- 1584 Laverne Ave
- 1622 Dennis Ave
- 1606 Barstow Ave
- 3497 Shaw Ave
- 860 Mcarthur Ave
- 1515 Keats Ave
- 1428 Miami Ave
- 2034 Wrenwood Ave
- 2214 Fordham Ave
- 937 Filbert Ave
- 2306 Stanford Ave
- 1946 Calimyrna Ave
- 1228 Jefferson Ave
- 2468 Laverne Ave
- 760 Sunnyside Ave
- 1856 Mitchell Ave
- 1835 Dennis Ave
- 1845 Dennis Ave
- 1448 Whittier Ave
- 1847 Mitchell Ave
- 1866 Mitchell Ave
- 1468 Whittier Ave
- 1857 Mitchell Ave
- 1837 Mitchell Ave
- 1867 Mitchell Ave
- 1488 Whittier Ave
- 1827 Mitchell Ave
- 1876 Mitchell Ave
- 1439 Fowler Ave
- 1854 Cougar Ln
- 1834 Dennis Ave
- 1459 Fowler Ave
- 1877 Mitchell Ave
- 1844 Dennis Ave
- 1865 Dennis Ave
Your Personal Tour Guide
Ask me questions while you tour the home.