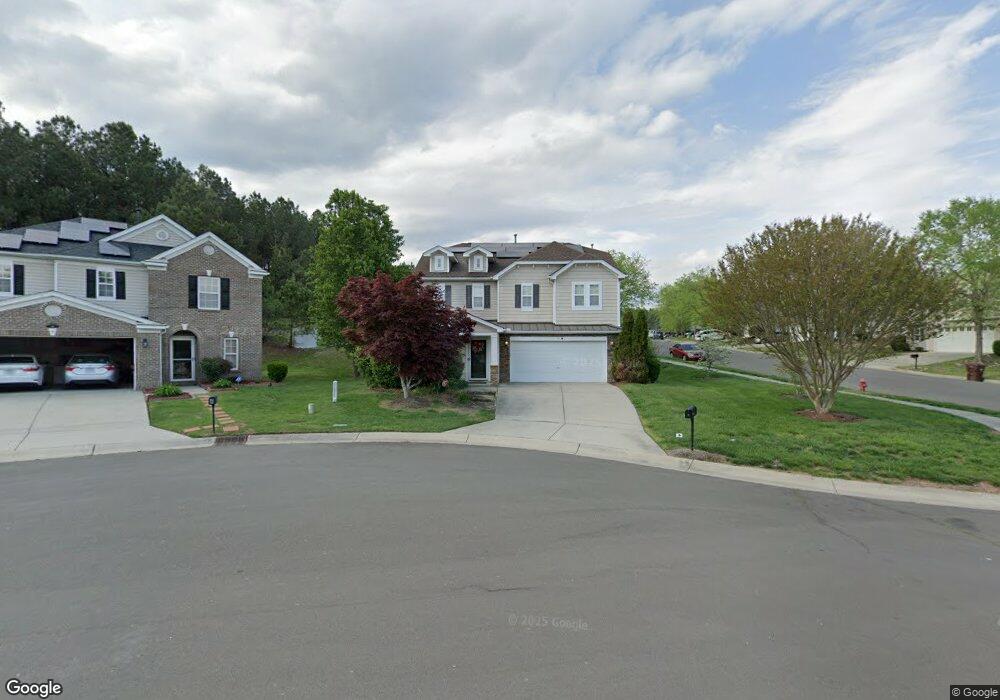
2 Red Spring Ct Durham, NC 27703
Eastern Durham NeighborhoodEstimated Value: $379,869 - $389,000
3
Beds
3
Baths
2,351
Sq Ft
$164/Sq Ft
Est. Value
About This Home
This home is located at 2 Red Spring Ct, Durham, NC 27703 and is currently estimated at $385,217, approximately $163 per square foot. 2 Red Spring Ct is a home located in Durham County with nearby schools including Glenn Elementary, John W Neal Middle School, and Southern School of Energy & Sustainability.
Ownership History
Date
Name
Owned For
Owner Type
Purchase Details
Closed on
Nov 6, 2015
Sold by
Hoffman William Cain
Bought by
Coley Toina
Current Estimated Value
Home Financials for this Owner
Home Financials are based on the most recent Mortgage that was taken out on this home.
Original Mortgage
$184,000
Outstanding Balance
$144,676
Interest Rate
3.78%
Mortgage Type
New Conventional
Estimated Equity
$240,541
Purchase Details
Closed on
Mar 26, 2012
Sold by
Raman R Varatharaju M and Tarmalingam Shanthi
Bought by
Hoffman William Cain
Home Financials for this Owner
Home Financials are based on the most recent Mortgage that was taken out on this home.
Original Mortgage
$122,556
Interest Rate
3.97%
Mortgage Type
New Conventional
Purchase Details
Closed on
Jan 24, 2005
Sold by
Kb Home Raleigh Durham Llc
Bought by
Raman R Varatharaju M
Home Financials for this Owner
Home Financials are based on the most recent Mortgage that was taken out on this home.
Original Mortgage
$162,454
Interest Rate
5.66%
Mortgage Type
New Conventional
Create a Home Valuation Report for This Property
The Home Valuation Report is an in-depth analysis detailing your home's value as well as a comparison with similar homes in the area
Home Values in the Area
Average Home Value in this Area
Purchase History
| Date | Buyer | Sale Price | Title Company |
|---|---|---|---|
| Coley Toina | $184,000 | Attorney | |
| Hoffman William Cain | $123,000 | None Available | |
| Raman R Varatharaju M | $162,500 | -- |
Source: Public Records
Mortgage History
| Date | Status | Borrower | Loan Amount |
|---|---|---|---|
| Open | Coley Toina | $184,000 | |
| Previous Owner | Hoffman William Cain | $122,556 | |
| Previous Owner | Raman R Varatharaju M | $162,454 |
Source: Public Records
Tax History
| Year | Tax Paid | Tax Assessment Tax Assessment Total Assessment is a certain percentage of the fair market value that is determined by local assessors to be the total taxable value of land and additions on the property. | Land | Improvement |
|---|---|---|---|---|
| 2025 | $3,955 | $398,984 | $73,125 | $325,859 |
| 2024 | $2,813 | $201,681 | $35,130 | $166,551 |
| 2023 | $2,642 | $201,681 | $35,130 | $166,551 |
| 2022 | $2,581 | $201,681 | $35,130 | $166,551 |
| 2021 | $2,569 | $201,681 | $35,130 | $166,551 |
| 2020 | $2,509 | $201,681 | $35,130 | $166,551 |
| 2019 | $2,509 | $201,681 | $35,130 | $166,551 |
| 2018 | $2,554 | $188,245 | $29,275 | $158,970 |
| 2017 | $2,535 | $188,245 | $29,275 | $158,970 |
| 2016 | $2,449 | $188,245 | $29,275 | $158,970 |
| 2015 | $2,833 | $204,684 | $35,279 | $169,405 |
| 2014 | $2,833 | $204,684 | $35,279 | $169,405 |
Source: Public Records
Map
Nearby Homes
- 409 Magna Dr
- 509 Pebblestone Dr
- 1034 Statler Dr
- 1511 Hatteras Rd
- 1509 Hatteras Rd
- 110 Rosebud Ln
- 1060 Gentle Reed Dr
- 2145 Topsail Rd
- 7 Duxford Ct
- 1454 Hatteras Rd
- 3721 Brightwood Ln
- 914 Flanders Dr
- 1452 Hatteras Rd
- 1143 Sweet Cream Ct
- 1113 Kindness Ln
- 1201 Opal Ln
- 3900 Mary Martin Rd
- 3822 Mary Martin Rd
- 608 Clearfield Dr
- 913 Valmet Dr
- 4 Red Spring Ct
- 403 Pebblestone Dr
- 6 Red Spring Ct
- 405 Pebblestone Dr
- 404 Pebblestone Dr
- 402 Pebblestone Dr
- 307 Pebblestone Dr
- 406 Pebblestone Dr
- 310 Pebblestone Dr
- 407 Pebblestone Dr
- 408 Pebblestone Dr
- 308 Pebblestone Dr
- 5 Red Spring Ct
- 3 Red Spring Ct
- 410 Pebblestone Dr
- 409 Pebblestone Dr
- 411 Magna Dr
- 306 Pebblestone Dr
- 413 Magna Dr
- 407 Magna Dr
Your Personal Tour Guide
Ask me questions while you tour the home.