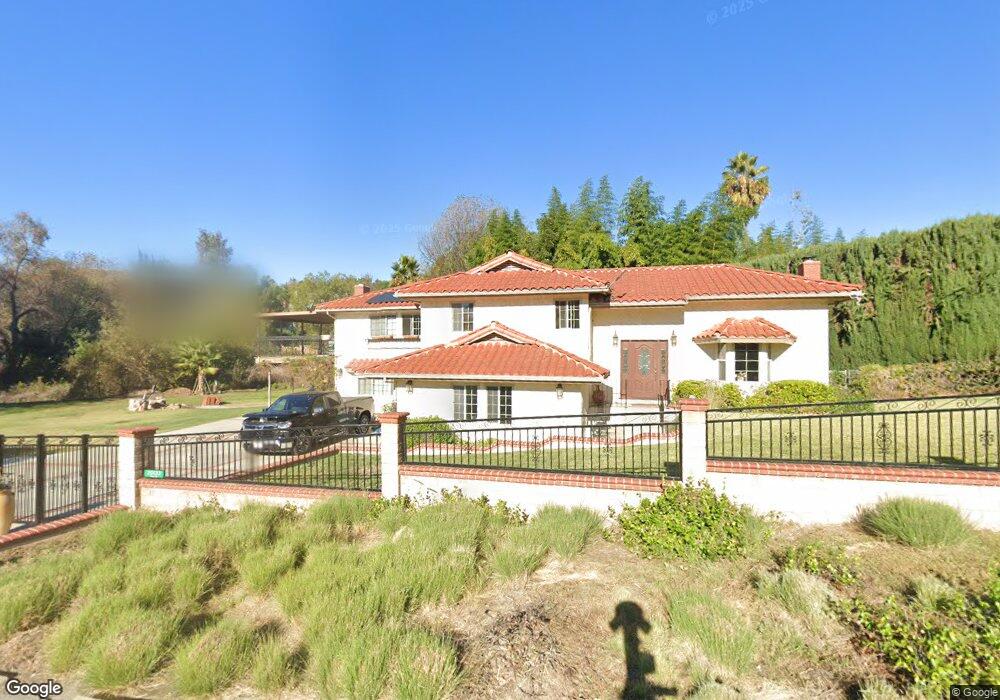
20133 Kelso Rd Walnut, CA 91789
Estimated Value: $1,241,000 - $1,535,000
4
Beds
3
Baths
2,480
Sq Ft
$566/Sq Ft
Est. Value
About This Home
This home is located at 20133 Kelso Rd, Walnut, CA 91789 and is currently estimated at $1,402,671, approximately $565 per square foot. 20133 Kelso Rd is a home located in Los Angeles County with nearby schools including Vejar Elementary School, Suzanne Middle School, and Walnut High School.
Ownership History
Date
Name
Owned For
Owner Type
Purchase Details
Closed on
Sep 12, 2025
Sold by
Villasenor Arturo Gonzalez
Bought by
Agv Family Trust and Villasenor
Current Estimated Value
Purchase Details
Closed on
Feb 27, 2017
Sold by
Meadowpass Development Llc
Bought by
Frontier California Inc
Purchase Details
Closed on
Feb 23, 1995
Sold by
World S & L Assn Fsla
Bought by
Villasenor Arturo G and Villasenor Elsa
Home Financials for this Owner
Home Financials are based on the most recent Mortgage that was taken out on this home.
Original Mortgage
$216,800
Interest Rate
9.09%
Mortgage Type
Seller Take Back
Purchase Details
Closed on
Jan 20, 1995
Sold by
Weyer Richard D and Weyer Erlinda M
Bought by
World S & L Assn Fsla
Home Financials for this Owner
Home Financials are based on the most recent Mortgage that was taken out on this home.
Original Mortgage
$216,800
Interest Rate
9.09%
Mortgage Type
Seller Take Back
Create a Home Valuation Report for This Property
The Home Valuation Report is an in-depth analysis detailing your home's value as well as a comparison with similar homes in the area
Home Values in the Area
Average Home Value in this Area
Purchase History
| Date | Buyer | Sale Price | Title Company |
|---|---|---|---|
| Agv Family Trust | -- | None Listed On Document | |
| Frontier California Inc | -- | None Available | |
| Villasenor Arturo G | $271,000 | Fidelity National Title | |
| World S & L Assn Fsla | $301,071 | Stewart Title |
Source: Public Records
Mortgage History
| Date | Status | Borrower | Loan Amount |
|---|---|---|---|
| Previous Owner | Villasenor Arturo G | $216,800 |
Source: Public Records
Tax History
| Year | Tax Paid | Tax Assessment Tax Assessment Total Assessment is a certain percentage of the fair market value that is determined by local assessors to be the total taxable value of land and additions on the property. | Land | Improvement |
|---|---|---|---|---|
| 2025 | $6,040 | $455,173 | $205,078 | $250,095 |
| 2024 | $6,040 | $446,249 | $201,057 | $245,192 |
| 2023 | $5,852 | $437,500 | $197,115 | $240,385 |
| 2022 | $5,685 | $428,922 | $193,250 | $235,672 |
| 2021 | $5,573 | $420,512 | $189,461 | $231,051 |
| 2020 | $5,506 | $416,201 | $187,519 | $228,682 |
| 2019 | $5,405 | $408,042 | $183,843 | $224,199 |
| 2018 | $5,116 | $400,042 | $180,239 | $219,803 |
| 2016 | $4,738 | $384,510 | $173,241 | $211,269 |
| 2015 | $4,765 | $378,735 | $170,639 | $208,096 |
| 2014 | $4,780 | $371,317 | $167,297 | $204,020 |
Source: Public Records
Map
Nearby Homes
- 19910 Tennessee Trail
- 792 El Vallencito Dr
- 1025 N Horseshoe Bend
- 20487 Gartel Dr
- 540 Citadel Dr
- 602 Lone Eagle Rd
- 19678 Three Oaks Ln
- 931 Sky Meadow Place
- 330 Amberwood Dr
- 0 Gartel Dr
- 19819 Camino Arroyo
- 805 Silver Valley Trail
- 19735 Arbor Ridge Dr
- 180 Ricci Ave
- 19933 Hidden Springs Rd
- 20824 Fuero Dr
- 1668 Chestnut Hill Dr
- 16 Camelback
- 15 Camelback Dr
- 21002 Cornerstone Dr
- 20161 Kelso Rd
- 20132 Kelso Rd
- 1259 Waterbrook Cir
- 20160 Kelso Rd
- 20171 Kelso Rd
- 920 Pierre Rd
- 880 Meadow Pass Rd
- 873 Streamview St
- 915 Belridge Ct
- 1280 Waterbrook Cir
- 921 Belridge Ct
- 20186 Fuerte Dr
- 905 Belridge Ct
- 921 N Sea Biscuit Ct
- 863 Streamview St
- 1358 Pierre Rd
- 927 N Sea Biscuit Ct
- 1299 Waterbrook Cir
- 870 Meadow Pass Rd
- 20150 Fuerte Dr
Your Personal Tour Guide
Ask me questions while you tour the home.