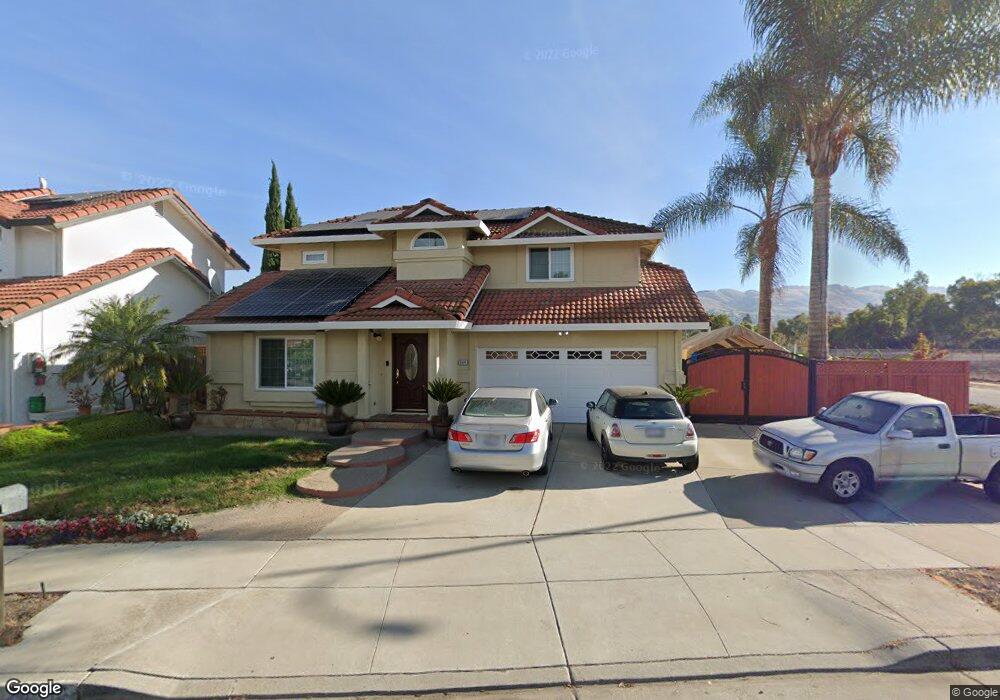
2020 Cunningham Ct San Jose, CA 95148
Ocala-Sundown NeighborhoodEstimated Value: $1,033,000 - $1,551,000
3
Beds
3
Baths
1,612
Sq Ft
$779/Sq Ft
Est. Value
About This Home
This home is located at 2020 Cunningham Ct, San Jose, CA 95148 and is currently estimated at $1,256,517, approximately $779 per square foot. 2020 Cunningham Ct is a home located in Santa Clara County with nearby schools including Thomas P. Ryan Elementary School, Ocala Middle School, and Mt. Pleasant High School.
Ownership History
Date
Name
Owned For
Owner Type
Purchase Details
Closed on
Nov 21, 2024
Sold by
Truong Huan and Vo Van T
Bought by
Huan Nghien Truong And Van Thanh Vo Revocable and Truong
Current Estimated Value
Purchase Details
Closed on
Apr 14, 1994
Sold by
Fahmy Sarwat S and Fahmy Colette J
Bought by
Vicente Johnnie S and Vicente Amelia Amy C
Home Financials for this Owner
Home Financials are based on the most recent Mortgage that was taken out on this home.
Original Mortgage
$202,050
Interest Rate
4.62%
Create a Home Valuation Report for This Property
The Home Valuation Report is an in-depth analysis detailing your home's value as well as a comparison with similar homes in the area
Home Values in the Area
Average Home Value in this Area
Purchase History
| Date | Buyer | Sale Price | Title Company |
|---|---|---|---|
| Huan Nghien Truong And Van Thanh Vo Revocable | -- | None Listed On Document | |
| Huan Nghien Truong And Van Thanh Vo Revocable | -- | None Listed On Document | |
| Vicente Johnnie S | $224,500 | Old Republic Title Company |
Source: Public Records
Mortgage History
| Date | Status | Borrower | Loan Amount |
|---|---|---|---|
| Previous Owner | Vicente Johnnie S | $202,050 |
Source: Public Records
Tax History
| Year | Tax Paid | Tax Assessment Tax Assessment Total Assessment is a certain percentage of the fair market value that is determined by local assessors to be the total taxable value of land and additions on the property. | Land | Improvement |
|---|---|---|---|---|
| 2025 | $8,812 | $568,657 | $227,458 | $341,199 |
| 2024 | $8,812 | $557,508 | $222,999 | $334,509 |
| 2023 | $8,632 | $546,577 | $218,627 | $327,950 |
| 2022 | $8,466 | $535,861 | $214,341 | $321,520 |
| 2021 | $8,172 | $525,355 | $210,139 | $315,216 |
| 2020 | $8,009 | $519,969 | $207,985 | $311,984 |
| 2019 | $7,787 | $509,774 | $203,907 | $305,867 |
| 2018 | $7,684 | $499,779 | $199,909 | $299,870 |
| 2017 | $7,708 | $489,981 | $195,990 | $293,991 |
| 2016 | $7,273 | $480,375 | $192,148 | $288,227 |
| 2015 | $7,268 | $473,160 | $189,262 | $283,898 |
| 2014 | $6,749 | $463,892 | $185,555 | $278,337 |
Source: Public Records
Map
Nearby Homes
- 1776 Home Gate Dr
- 3165 Coldwater Dr
- 2736 Twin Oaks Ln
- 2030 Flintbury Ct
- 1572 Amesbury Way
- 1729 Adrian Way
- 1872 Quimby Rd Unit 1872
- 3282 Mount Everest Dr
- 2571 Gumdrop Dr
- 2667 Sand Point Dr
- 2808 Quest Ct
- 3381 Mount Everest Dr
- 10230 Griffith St
- 3455 Cuesta Dr
- 3485 Rubion Ct
- 10121 Torrance Ave
- 1542 Harvest Dr
- 2275 Astrahan Ln
- 1310 Park Pleasant Cir
- 2955 Vineyard Park Dr
- 2014 Cunningham Ct
- 2951 Cunningham Ave
- 2008 Cunningham Ct
- 2184 Cunningham Ct
- 2955 Cunningham Ave
- 2180 Cunningham Ct
- 2019 Cunningham Ct
- 2002 Cunningham Ct
- 2959 Cunningham Ave
- 2017 Cunningham Ct
- 2179 Cunningham Ct
- 2015 Cunningham Ct
- 2183 Cunningham Ct
- 2013 Cunningham Ct
- 2825 Cunningham Ave
- 2187 Cunningham Ct
- 2199 Cunningham Ct
- 2003 Cunningham Ct
- 2191 Cunningham Ct
- 2007 Cunningham Ct
Your Personal Tour Guide
Ask me questions while you tour the home.