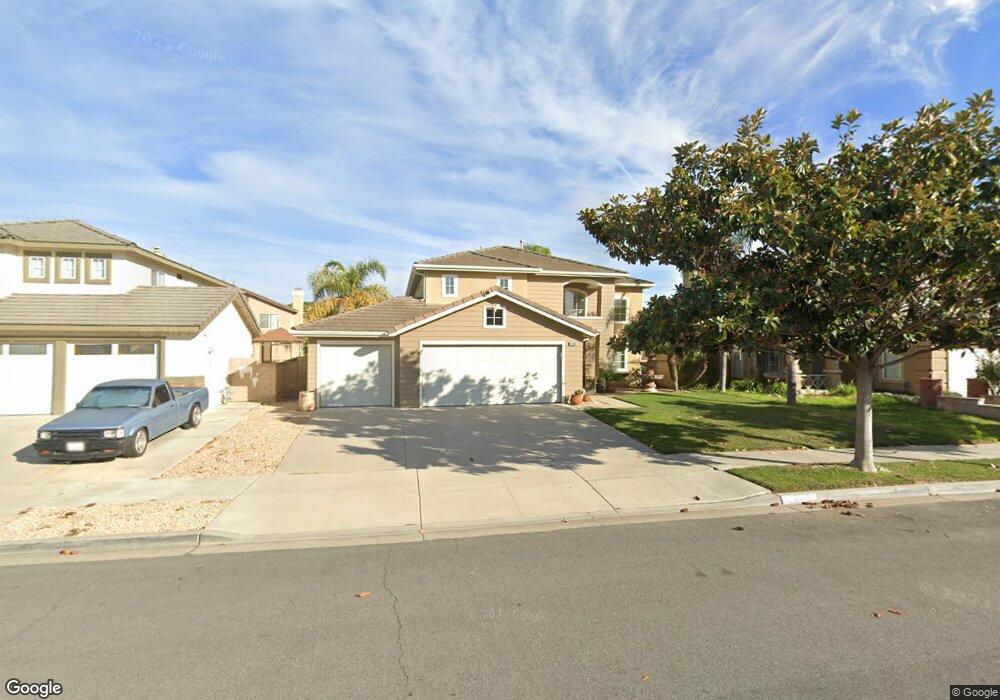
2068 Dulce Dr Oxnard, CA 93036
Rio Lindo NeighborhoodEstimated Value: $907,587 - $944,000
4
Beds
3
Baths
1,906
Sq Ft
$485/Sq Ft
Est. Value
About This Home
This home is located at 2068 Dulce Dr, Oxnard, CA 93036 and is currently estimated at $923,647, approximately $484 per square foot. 2068 Dulce Dr is a home located in Ventura County with nearby schools including Rio Lindo Elementary School, Rio Del Valle Middle School, and Pacifica High School.
Ownership History
Date
Name
Owned For
Owner Type
Purchase Details
Closed on
May 13, 2019
Sold by
Montesisnos Patricia Ramirez De and Martinez Hector
Bought by
Martinez Hector and Montesinos Patricia Ramirez De
Current Estimated Value
Home Financials for this Owner
Home Financials are based on the most recent Mortgage that was taken out on this home.
Original Mortgage
$219,526
Outstanding Balance
$142,514
Interest Rate
4%
Mortgage Type
New Conventional
Estimated Equity
$781,133
Purchase Details
Closed on
Feb 9, 2016
Sold by
Montesinos Patricia
Bought by
Montesinos Patricia and Gamez Hector Martinez
Purchase Details
Closed on
Dec 23, 2004
Sold by
Montesinos Ricardo and Montesinos Patricia
Bought by
Montesinos Patricia
Purchase Details
Closed on
Oct 10, 1995
Sold by
Oxnard 113 Partners Lp
Bought by
Montesinos Ricardo and Montesinos Patricia
Home Financials for this Owner
Home Financials are based on the most recent Mortgage that was taken out on this home.
Original Mortgage
$203,150
Interest Rate
7.37%
Create a Home Valuation Report for This Property
The Home Valuation Report is an in-depth analysis detailing your home's value as well as a comparison with similar homes in the area
Home Values in the Area
Average Home Value in this Area
Purchase History
| Date | Buyer | Sale Price | Title Company |
|---|---|---|---|
| Martinez Hector | -- | Lawyers Title Company | |
| Montesinos Patricia | -- | None Available | |
| Montesinos Patricia | -- | -- | |
| Montesinos Ricardo | $215,000 | Chicago Title |
Source: Public Records
Mortgage History
| Date | Status | Borrower | Loan Amount |
|---|---|---|---|
| Open | Martinez Hector | $219,526 | |
| Previous Owner | Montesinos Ricardo | $203,150 |
Source: Public Records
Tax History
| Year | Tax Paid | Tax Assessment Tax Assessment Total Assessment is a certain percentage of the fair market value that is determined by local assessors to be the total taxable value of land and additions on the property. | Land | Improvement |
|---|---|---|---|---|
| 2025 | $4,285 | $357,119 | $142,842 | $214,277 |
| 2024 | $4,285 | $350,117 | $140,041 | $210,076 |
| 2023 | $4,067 | $343,252 | $137,295 | $205,957 |
| 2022 | $3,932 | $336,522 | $134,603 | $201,919 |
| 2021 | $3,967 | $329,924 | $131,964 | $197,960 |
| 2020 | $4,016 | $326,543 | $130,612 | $195,931 |
| 2019 | $3,829 | $320,141 | $128,051 | $192,090 |
| 2018 | $3,658 | $313,865 | $125,541 | $188,324 |
| 2017 | $3,559 | $307,712 | $123,080 | $184,632 |
| 2016 | $3,476 | $301,679 | $120,667 | $181,012 |
| 2015 | $3,640 | $297,149 | $118,855 | $178,294 |
| 2014 | $3,488 | $291,330 | $116,528 | $174,802 |
Source: Public Records
Map
Nearby Homes
- 209 Lafayette Dr
- 2250 Mono St
- 2016 Blackberry Cir
- 2160 Blackberry Cir
- 2005 Blackberry Cir
- 1842 Sonata Dr
- 2041 Blackberry Cir
- 2225 Edelweiss St Unit 43
- 650 Bluebell Place
- 620 W Gonzales Rd
- 620 W Gonzales Rd Unit B
- 620 W Gonzales Rd Unit C
- 620 W Gonzales Rd Unit D
- 620 W Gonzales Rd Unit A
- 2701 Alvarado St
- 2408 Apple Ln Unit 154
- 550 Holly Ave
- 411 Eastwood Dr
- 1623 Lola Way
- 2475 Apple Ln Unit 129
Your Personal Tour Guide
Ask me questions while you tour the home.