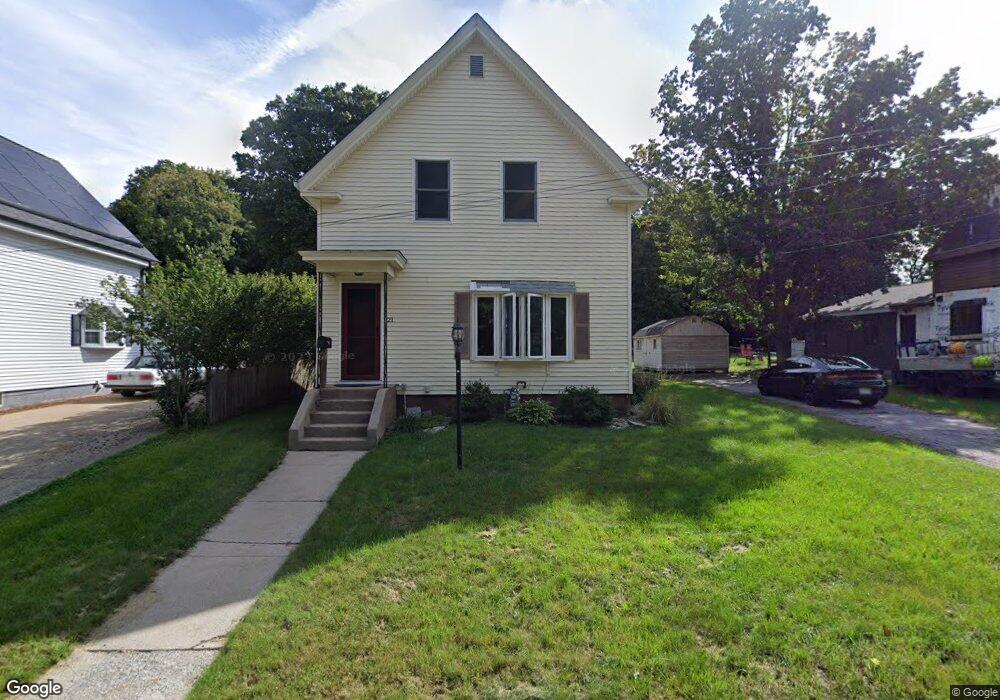
21 Thayer St Franklin, MA 02038
Downtown Franklin NeighborhoodEstimated Value: $462,292 - $543,000
3
Beds
2
Baths
1,225
Sq Ft
$414/Sq Ft
Est. Value
About This Home
This home is located at 21 Thayer St, Franklin, MA 02038 and is currently estimated at $506,573, approximately $413 per square foot. 21 Thayer St is a home located in Norfolk County with nearby schools including Helen Keller Elementary School, Annie Sullivan Middle School, and Franklin High School.
Ownership History
Date
Name
Owned For
Owner Type
Purchase Details
Closed on
Jul 6, 1995
Sold by
Pisani Rocco M and Pisani Olympia N
Bought by
Puopolo Nicholas S and Buopolo Ann L
Current Estimated Value
Home Financials for this Owner
Home Financials are based on the most recent Mortgage that was taken out on this home.
Original Mortgage
$111,100
Interest Rate
7.84%
Mortgage Type
Purchase Money Mortgage
Create a Home Valuation Report for This Property
The Home Valuation Report is an in-depth analysis detailing your home's value as well as a comparison with similar homes in the area
Home Values in the Area
Average Home Value in this Area
Purchase History
| Date | Buyer | Sale Price | Title Company |
|---|---|---|---|
| Puopolo Nicholas S | $117,000 | -- |
Source: Public Records
Mortgage History
| Date | Status | Borrower | Loan Amount |
|---|---|---|---|
| Open | Puopolo Nicholas S | $107,000 | |
| Closed | Puopolo Nicholas S | $111,100 |
Source: Public Records
Tax History
| Year | Tax Paid | Tax Assessment Tax Assessment Total Assessment is a certain percentage of the fair market value that is determined by local assessors to be the total taxable value of land and additions on the property. | Land | Improvement |
|---|---|---|---|---|
| 2025 | $4,992 | $429,600 | $235,800 | $193,800 |
| 2024 | $4,835 | $410,100 | $235,800 | $174,300 |
| 2023 | $5,146 | $409,100 | $257,400 | $151,700 |
| 2022 | $4,634 | $329,800 | $196,500 | $133,300 |
| 2021 | $4,498 | $307,000 | $204,600 | $102,400 |
| 2020 | $4,405 | $303,600 | $206,400 | $97,200 |
| 2019 | $4,080 | $278,300 | $181,100 | $97,200 |
| 2018 | $3,979 | $271,600 | $184,700 | $86,900 |
| 2017 | $3,907 | $268,000 | $181,100 | $86,900 |
| 2016 | $3,808 | $262,600 | $188,100 | $74,500 |
| 2015 | $3,627 | $244,400 | $169,900 | $74,500 |
| 2014 | $3,461 | $239,500 | $165,000 | $74,500 |
Source: Public Records
Map
Nearby Homes
- 163 W Central St
- 120 Union St Unit 1
- 374-378 Union St
- 3 Washington St
- 1 Washington St
- 88 Crescent St
- 99 Summer St
- 14 Pleasant St Unit B
- 37 Cross St
- 82 Uncas Ave
- 80 Uncas Ave
- 76 Uncas Ave
- 66 Uncas Ave
- 68 Uncas Ave
- 62 Uncas Ave
- 60 Uncas Ave
- 6 Pine Knoll Rd
- 78 Highwood Dr
- 17 Longhill Rd
- 602 Franklin Crossing Rd Unit 602
- 15 Thayer St
- 25 Thayer St
- 43 Mccarthy St
- 47 Mccarthy St
- 39 Mccarthy St
- 55 Mccarthy St
- 52 Mccarthy St
- 19 Mccarthy St
- 15 Mccarthy St
- 15 Mccarthy St Unit 2
- 26 Mccarthy St
- 26 Mccarthy St Unit 1
- 60 Fisher St
- 40 Mccarthy St
- 58 Mccarthy St
- 62 Fisher St
- 11 Mccarthy St
- 227 Union St
- 227 Union St Unit 2
- 227 Union St Unit 1
Your Personal Tour Guide
Ask me questions while you tour the home.