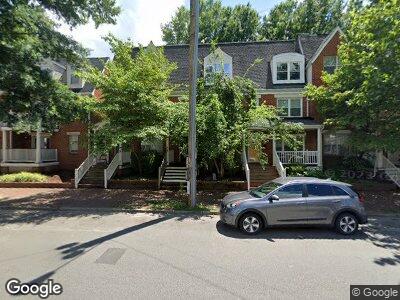
2111 W Cary St Unit 1 Richmond, VA 23220
The Fan NeighborhoodEstimated Value: $384,000 - $498,000
3
Beds
2
Baths
1,456
Sq Ft
$302/Sq Ft
Est. Value
About This Home
This home is located at 2111 W Cary St Unit 1, Richmond, VA 23220 and is currently estimated at $440,009, approximately $302 per square foot. 2111 W Cary St Unit 1 is a home located in Richmond City with nearby schools including Dogwood Middle School, Open High School, and Thomas Jefferson High School.
Ownership History
Date
Name
Owned For
Owner Type
Purchase Details
Closed on
Oct 31, 2022
Sold by
Powell Brandon C
Bought by
Brandon C Powell Revocable Trust
Current Estimated Value
Purchase Details
Closed on
Mar 24, 2003
Sold by
Carter Jacqueline
Bought by
Powell Brandon C
Home Financials for this Owner
Home Financials are based on the most recent Mortgage that was taken out on this home.
Original Mortgage
$76,400
Interest Rate
5.9%
Mortgage Type
New Conventional
Purchase Details
Closed on
Sep 20, 2000
Bought by
Patron Joyce D
Home Financials for this Owner
Home Financials are based on the most recent Mortgage that was taken out on this home.
Original Mortgage
$70,207
Interest Rate
8%
Mortgage Type
FHA
Create a Home Valuation Report for This Property
The Home Valuation Report is an in-depth analysis detailing your home's value as well as a comparison with similar homes in the area
Home Values in the Area
Average Home Value in this Area
Purchase History
| Date | Buyer | Sale Price | Title Company |
|---|---|---|---|
| Brandon C Powell Revocable Trust | -- | -- | |
| Powell Brandon C | $95,500 | -- | |
| Patron Joyce D | $95,000 | -- |
Source: Public Records
Mortgage History
| Date | Status | Borrower | Loan Amount |
|---|---|---|---|
| Previous Owner | Powell Brandon C | $86,410 | |
| Previous Owner | Powell Brandon C | $83,900 | |
| Previous Owner | Patron Joyce D | $76,400 | |
| Previous Owner | Patron Joyce D | $70,207 |
Source: Public Records
Tax History Compared to Growth
Tax History
| Year | Tax Paid | Tax Assessment Tax Assessment Total Assessment is a certain percentage of the fair market value that is determined by local assessors to be the total taxable value of land and additions on the property. | Land | Improvement |
|---|---|---|---|---|
| 2025 | $4,584 | $382,000 | $190,000 | $192,000 |
| 2024 | $4,248 | $354,000 | $170,000 | $184,000 |
| 2023 | $4,092 | $341,000 | $170,000 | $171,000 |
| 2022 | $3,264 | $272,000 | $115,000 | $157,000 |
| 2021 | $2,856 | $249,000 | $95,000 | $154,000 |
| 2020 | $2,856 | $238,000 | $90,000 | $148,000 |
| 2019 | $2,640 | $220,000 | $90,000 | $130,000 |
| 2018 | $2,244 | $187,000 | $75,000 | $112,000 |
| 2017 | $2,148 | $179,000 | $50,000 | $129,000 |
| 2016 | $2,004 | $167,000 | $50,000 | $117,000 |
| 2015 | $1,824 | $166,000 | $50,000 | $116,000 |
| 2014 | $1,824 | $152,000 | $40,000 | $112,000 |
Source: Public Records
Map
Nearby Homes
- 103 S Rowland St
- 2203 W Cary St
- 17 S Meadow St
- 2103 Floyd Ave
- 2111 Floyd Ave
- 2124 Floyd Ave
- 1 N Granby St
- 2322 Herbert Hamlet Alley Unit 10
- 1 N Stafford Ave
- 1827 W Cary St Unit D
- 2321 Apple Alley
- 2303 Apple Alley
- 2315 Apple Alley
- 1823 W Cary St Unit D
- 1823 W Cary St Unit B
- 203 S Stafford Ave
- 2310 Floyd Ave
- 207 S Stafford Ave
- 205 S Stafford Ave
- 201 S Stafford Ave
- 2111 W Cary St
- 2111 W Cary St Unit 1
- 2113 W Cary St
- 2109 W Cary St
- 2115 W Cary St
- 2115 W Cary St
- 2117 W Cary St
- 2107 W Cary St
- 2119 W Cary St
- 2119 W Cary St Unit 1
- 2121 W Cary St
- 2121 W Cary St Unit 3
- 2105 W Cary St
- 103 S Shields Ave
- 2123 W Cary St
- 2114 Parkwood Ave
- 2112 Parkwood Ave
- 2116 Parkwood Ave
- 2125 W Cary St
- 2114 W Cary St