Estimated Value: $1,062,000 - $1,125,000
3
Beds
2
Baths
1,459
Sq Ft
$748/Sq Ft
Est. Value
About This Home
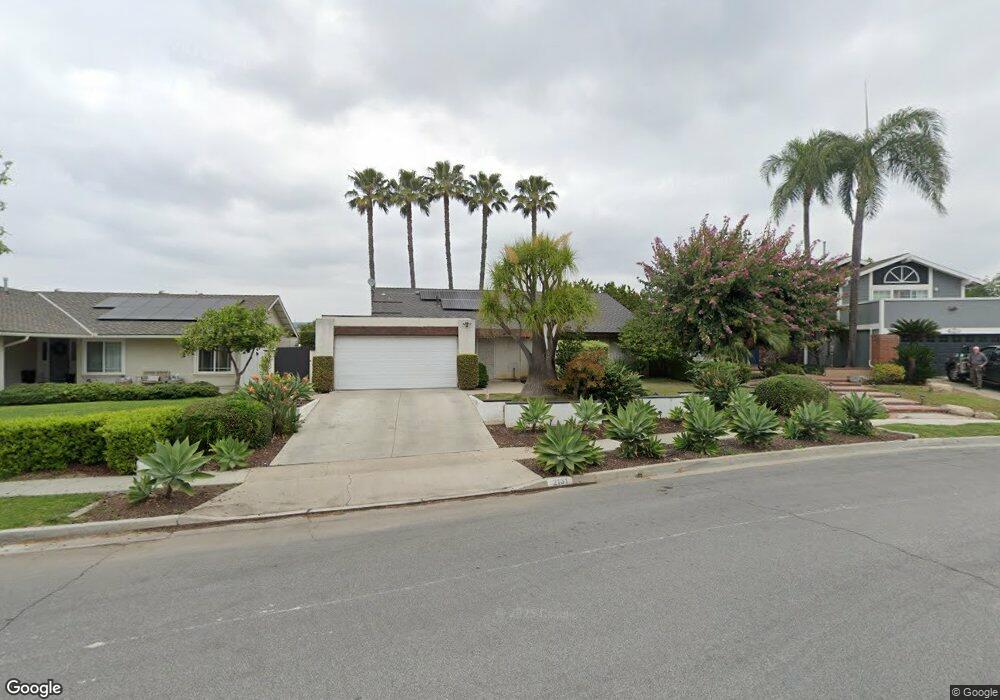
This home is located at 2131 Hillhaven Dr, Brea, CA 92821 and is currently estimated at $1,091,328, approximately $747 per square foot. 2131 Hillhaven Dr is a home located in Orange County with nearby schools including Brea Country Hills Elementary School, Brea Junior High School, and Brea-Olinda High School.
Ownership History
Date
Name
Owned For
Owner Type
Purchase Details
Closed on
Oct 28, 2009
Sold by
Shah Vinay K
Bought by
Shah Vinay K and Shah Shital Vinay
Current Estimated Value
Home Financials for this Owner
Home Financials are based on the most recent Mortgage that was taken out on this home.
Original Mortgage
$364,000
Outstanding Balance
$235,603
Interest Rate
4.83%
Mortgage Type
New Conventional
Estimated Equity
$855,725
Purchase Details
Closed on
Oct 27, 2009
Sold by
Shah Shital V
Bought by
Shah Vinay K
Home Financials for this Owner
Home Financials are based on the most recent Mortgage that was taken out on this home.
Original Mortgage
$364,000
Outstanding Balance
$235,603
Interest Rate
4.83%
Mortgage Type
New Conventional
Estimated Equity
$855,725
Purchase Details
Closed on
Jul 11, 2001
Sold by
Benson Harold C
Bought by
Benson Harold C and Harold C Benson Separate Property Tr
Purchase Details
Closed on
Jul 27, 1994
Sold by
Benson Jane O
Bought by
Benson Jane O
Create a Home Valuation Report for This Property
The Home Valuation Report is an in-depth analysis detailing your home's value as well as a comparison with similar homes in the area
Home Values in the Area
Average Home Value in this Area
Purchase History
| Date | Buyer | Sale Price | Title Company |
|---|---|---|---|
| Shah Vinay K | -- | Fidelity National Title | |
| Shah Vinay K | $455,000 | Fidelity National Title | |
| Shah Vinay K | -- | Fidelity National Title | |
| Benson Harold C | -- | -- | |
| Benson Harold C | -- | -- | |
| Benson Jane O | -- | -- |
Source: Public Records
Mortgage History
| Date | Status | Borrower | Loan Amount |
|---|---|---|---|
| Open | Shah Vinay K | $364,000 |
Source: Public Records
Tax History
| Year | Tax Paid | Tax Assessment Tax Assessment Total Assessment is a certain percentage of the fair market value that is determined by local assessors to be the total taxable value of land and additions on the property. | Land | Improvement |
|---|---|---|---|---|
| 2025 | $6,626 | $587,318 | $455,976 | $131,342 |
| 2024 | $6,626 | $575,802 | $447,035 | $128,767 |
| 2023 | $6,442 | $564,512 | $438,269 | $126,243 |
| 2022 | $6,380 | $553,444 | $429,676 | $123,768 |
| 2021 | $6,260 | $542,593 | $421,251 | $121,342 |
| 2020 | $6,217 | $537,030 | $416,932 | $120,098 |
| 2019 | $6,050 | $526,500 | $408,756 | $117,744 |
| 2018 | $5,958 | $516,177 | $400,741 | $115,436 |
| 2017 | $5,844 | $506,056 | $392,883 | $113,173 |
| 2016 | $5,728 | $496,134 | $385,180 | $110,954 |
| 2015 | $5,647 | $488,682 | $379,394 | $109,288 |
| 2014 | $5,483 | $479,110 | $371,962 | $107,148 |
Source: Public Records
Map
Nearby Homes
- 1796 Ravencrest Dr
- 136 Donnybrook Rd
- 2304 Carrotwood Dr
- 2050 Fallingleaf Cir
- 2851 Rolling Hills Dr Unit 257
- 2851 Rolling Hills Dr Unit 248
- 2851 Rolling Hills Dr
- 2826 Lemonwood Ct
- 213 Appalachian Cir
- 206 Allegheny Cir
- 2363 Morning Dew Dr
- 3054 Associated Rd Unit 20
- 2583 Sandpebble Ln
- 3010 Associated Rd Unit 122
- 3000 Associated Rd Unit 60
- 2733 Quail Ridge Cir Unit 32
- 2761 E Stearns St
- 2541 Thorn Place
- 2760 Quail Ridge Cir Unit 57
- 2454 Beacon St
- 2121 Hillhaven Dr
- 2141 Hillhaven Dr
- 2130 Heather Ln
- 2110 Heather Ln
- 2140 Heather Ln
- 2115 Hillhaven Dr
- 400 Devonshire Dr
- 403 Devonshire Dr
- 2100 Heather Ln
- 364 Devonshire Dr
- 402 Devonshire Dr
- 2118 Hillhaven Dr
- 409 Devonshire Dr
- 408 Devonshire Dr
- 2112 Hillhaven Dr
- 355 Devonshire Dr
- 356 Devonshire Dr
- 354 Amberwick Ln
- 397 Amberwick Ln
- 385 Amberwick Ln
Your Personal Tour Guide
Ask me questions while you tour the home.