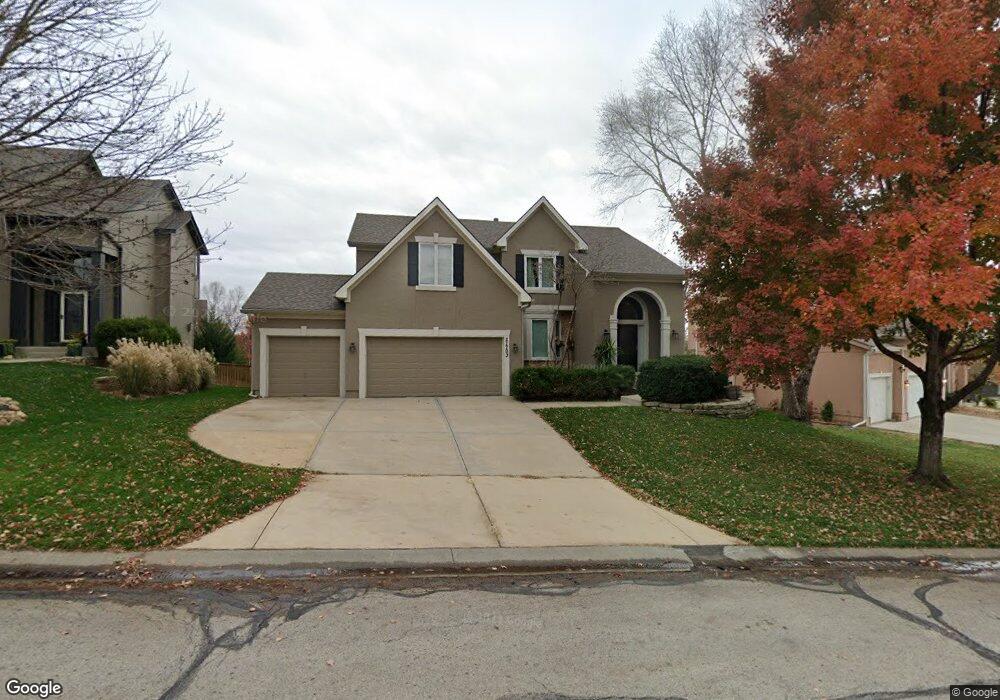
21703 W 60th St Shawnee, KS 66218
Estimated Value: $496,000 - $584,000
4
Beds
4
Baths
2,635
Sq Ft
$206/Sq Ft
Est. Value
About This Home
This home is located at 21703 W 60th St, Shawnee, KS 66218 and is currently estimated at $542,707, approximately $205 per square foot. 21703 W 60th St is a home located in Johnson County with nearby schools including Clear Creek Elementary School, Monticello Trails Middle School, and Mill Valley High School.
Ownership History
Date
Name
Owned For
Owner Type
Purchase Details
Closed on
Aug 21, 2003
Sold by
Tusher Bruce A and Tusher Kimberly C
Bought by
Best Gregg L and Miller Best Lisa A
Current Estimated Value
Home Financials for this Owner
Home Financials are based on the most recent Mortgage that was taken out on this home.
Original Mortgage
$195,000
Outstanding Balance
$86,432
Interest Rate
5.71%
Mortgage Type
Purchase Money Mortgage
Estimated Equity
$456,275
Purchase Details
Closed on
Aug 27, 2001
Sold by
Woodstone Homes Inc
Bought by
Tusher Bruce A and Tusher Kimberly C
Home Financials for this Owner
Home Financials are based on the most recent Mortgage that was taken out on this home.
Original Mortgage
$246,600
Interest Rate
6.98%
Create a Home Valuation Report for This Property
The Home Valuation Report is an in-depth analysis detailing your home's value as well as a comparison with similar homes in the area
Home Values in the Area
Average Home Value in this Area
Purchase History
| Date | Buyer | Sale Price | Title Company |
|---|---|---|---|
| Best Gregg L | -- | Columbian Title | |
| Tusher Bruce A | -- | Security Land Title Company |
Source: Public Records
Mortgage History
| Date | Status | Borrower | Loan Amount |
|---|---|---|---|
| Open | Best Gregg L | $195,000 | |
| Previous Owner | Tusher Bruce A | $246,600 |
Source: Public Records
Tax History Compared to Growth
Tax History
| Year | Tax Paid | Tax Assessment Tax Assessment Total Assessment is a certain percentage of the fair market value that is determined by local assessors to be the total taxable value of land and additions on the property. | Land | Improvement |
|---|---|---|---|---|
| 2024 | $6,392 | $54,855 | $9,688 | $45,167 |
| 2023 | $6,433 | $54,671 | $9,688 | $44,983 |
| 2022 | $6,000 | $49,967 | $8,804 | $41,163 |
| 2021 | $5,553 | $44,505 | $8,002 | $36,503 |
| 2020 | $5,533 | $43,953 | $8,002 | $35,951 |
| 2019 | $5,391 | $42,194 | $6,959 | $35,235 |
| 2018 | $4,875 | $37,801 | $6,959 | $30,842 |
| 2017 | $4,963 | $37,548 | $6,054 | $31,494 |
| 2016 | $4,876 | $36,443 | $5,766 | $30,677 |
| 2015 | $4,759 | $34,914 | $5,766 | $29,148 |
| 2013 | -- | $32,418 | $5,766 | $26,652 |
Source: Public Records
Map
Nearby Homes
- 6031 Lakecrest Dr
- 21609 W 61st St
- 5900 Redbud St
- 5722 Payne St
- 6046 Redbud St
- 5725 Marion St
- 21315 W 56th St
- 21309 W 56th St
- 22209 W 57th St
- 21217 W 55th Terrace
- 22310 W 58th St
- 5817 Millbrook St
- 6358 Hilltop St
- 24621 W 60th St
- 5531 Hilltop Dr
- 6246 Woodland Dr
- 22429 W 64th St
- 21624 W 53rd Terrace
- 22605 W 56th St
- 5405 Lakecrest Dr
- 21613 W 60th St
- 21707 W 60th St
- 6003 Noreston St
- 6016 Lone Elm Rd
- 21607 W 60th St
- 6012 Lone Elm Rd
- 6020 Lone Elm Rd
- 21702 W 60th St
- 21616 W 60th St
- 6007 Noreston St
- 6008 Lone Elm Rd
- 21706 W 60th St
- 21612 W 60th St
- 6004 Lone Elm Rd
- 6011 Noreston St
- 6000 Lone Elm Rd
- 6024 Lone Elm Rd
- 21608 W 60th St
- 21802 W 60th St
- 6000 Noreston St