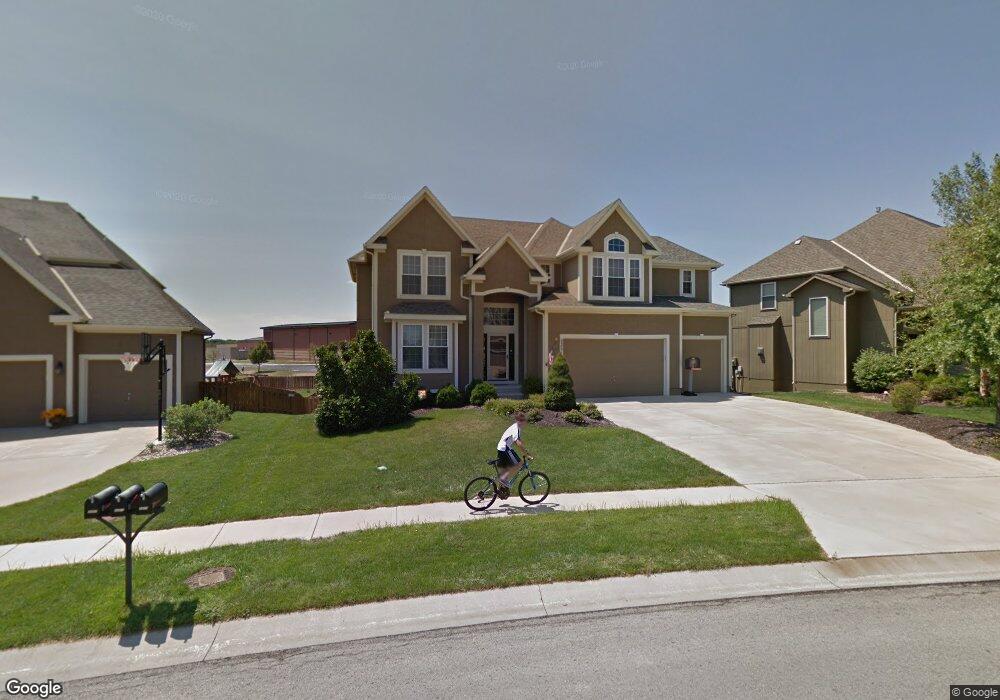
22211 W 59th St Shawnee, KS 66226
Estimated Value: $521,495 - $571,000
4
Beds
4
Baths
2,472
Sq Ft
$221/Sq Ft
Est. Value
About This Home
This home is located at 22211 W 59th St, Shawnee, KS 66226 and is currently estimated at $546,624, approximately $221 per square foot. 22211 W 59th St is a home located in Johnson County with nearby schools including Prairie Ridge Elementary School, Monticello Trails Middle School, and Mill Valley High School.
Ownership History
Date
Name
Owned For
Owner Type
Purchase Details
Closed on
Oct 2, 2006
Sold by
Turvey Paul Robert and Turvey Maria Elizabeth
Bought by
Turvey Paul Robert and Turvey Maria Elizabeth
Current Estimated Value
Home Financials for this Owner
Home Financials are based on the most recent Mortgage that was taken out on this home.
Original Mortgage
$76,000
Outstanding Balance
$45,301
Interest Rate
6.44%
Mortgage Type
Stand Alone Second
Estimated Equity
$501,323
Purchase Details
Closed on
Aug 5, 2005
Sold by
Concord Homes Llc
Bought by
Turvey Paul Robert and Kepka Maria Elizabeth
Home Financials for this Owner
Home Financials are based on the most recent Mortgage that was taken out on this home.
Original Mortgage
$43,800
Interest Rate
5.8%
Mortgage Type
Stand Alone Second
Purchase Details
Closed on
Apr 22, 2005
Sold by
Rodrock Homes Inc
Bought by
Concord Homes Llc
Create a Home Valuation Report for This Property
The Home Valuation Report is an in-depth analysis detailing your home's value as well as a comparison with similar homes in the area
Home Values in the Area
Average Home Value in this Area
Purchase History
| Date | Buyer | Sale Price | Title Company |
|---|---|---|---|
| Turvey Paul Robert | -- | None Available | |
| Turvey Paul Robert | -- | First American Title | |
| Concord Homes Llc | -- | First American Title |
Source: Public Records
Mortgage History
| Date | Status | Borrower | Loan Amount |
|---|---|---|---|
| Open | Turvey Paul Robert | $76,000 | |
| Closed | Turvey Paul Robert | $43,800 | |
| Open | Turvey Paul Robert | $233,600 |
Source: Public Records
Tax History Compared to Growth
Tax History
| Year | Tax Paid | Tax Assessment Tax Assessment Total Assessment is a certain percentage of the fair market value that is determined by local assessors to be the total taxable value of land and additions on the property. | Land | Improvement |
|---|---|---|---|---|
| 2024 | $6,447 | $55,315 | $10,059 | $45,256 |
| 2023 | $6,256 | $53,176 | $9,576 | $43,600 |
| 2022 | $5,950 | $49,554 | $9,121 | $40,433 |
| 2021 | $5,291 | $42,400 | $8,289 | $34,111 |
| 2020 | $5,324 | $42,285 | $8,289 | $33,996 |
| 2019 | $5,259 | $41,158 | $7,538 | $33,620 |
| 2018 | $4,899 | $37,985 | $6,854 | $31,131 |
| 2017 | $4,987 | $37,732 | $5,955 | $31,777 |
| 2016 | $4,785 | $35,754 | $5,955 | $29,799 |
| 2015 | $4,731 | $34,707 | $5,955 | $28,752 |
| 2013 | -- | $32,074 | $5,955 | $26,119 |
Source: Public Records
Map
Nearby Homes
- 22209 W 57th St
- 5722 Payne St
- 22310 W 58th St
- 24621 W 60th St
- 22605 W 56th St
- 5531 Hilltop Dr
- 6358 Hilltop St
- 21609 W 61st St
- 5408 Aminda St
- 6031 Lakecrest Dr
- 5402 Roundtree St
- 22429 W 64th St
- 21315 W 56th St
- 21309 W 56th St
- 5900 Redbud St
- 21624 W 53rd Terrace
- 5725 Marion St
- 5625 Meadow View Dr
- 21217 W 55th Terrace
- 6046 Redbud St
- 22207 W 59th St
- 22215 W 59th St
- 22203 W 59th St
- 22210 W 59th St
- 22121 W 59th St
- 22214 W 59th St
- 22300 W 59th St
- 5831 Roundtree St
- 22119 W 59th St
- 22301 W 59th St
- 5818 Roundtree St
- 22205 W 58th Terrace
- 22304 W 59th St
- 22113 W 59th St
- 5823 Roundtree St
- 22404 W 59th Terrace
- 23810 Clearcreek Pkwy
- 22209 W 58th Terrace
- 22109 W 59th St
- 5814 Roundtree St