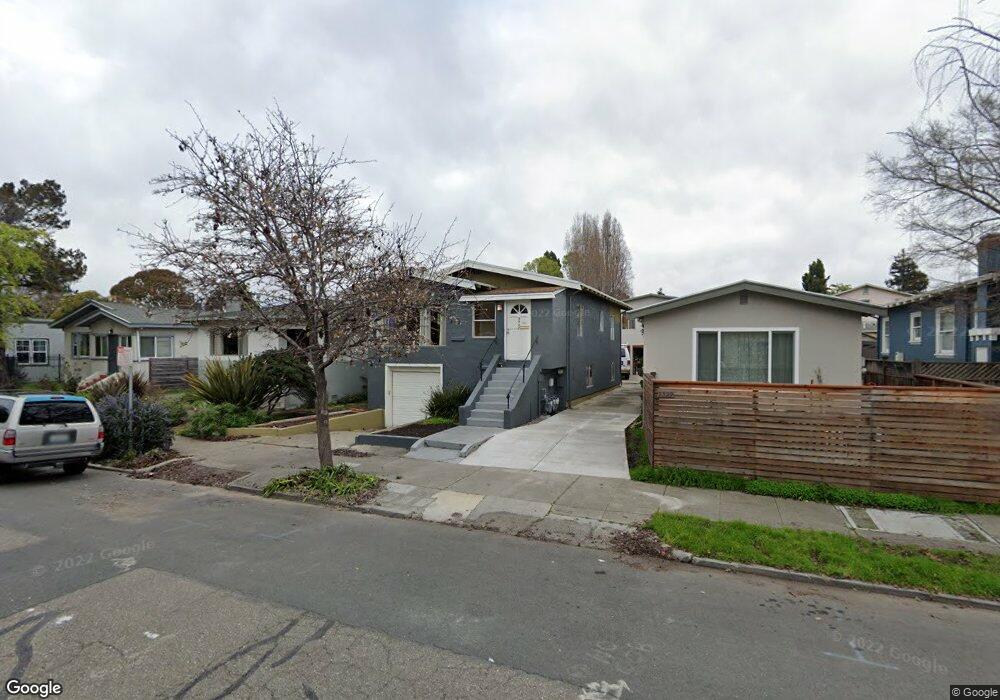
2327 Browning St Berkeley, CA 94702
West Berkeley NeighborhoodEstimated Value: $1,628,000 - $2,183,000
2
Beds
1
Bath
650
Sq Ft
$3,061/Sq Ft
Est. Value
About This Home
This home is located at 2327 Browning St, Berkeley, CA 94702 and is currently estimated at $1,989,501, approximately $3,060 per square foot. 2327 Browning St is a home located in Alameda County with nearby schools including Rosa Parks Elementary School, Ruth Acty Elementary, and Berkeley Arts Magnet at Whittier School.
Ownership History
Date
Name
Owned For
Owner Type
Purchase Details
Closed on
Jul 24, 2019
Sold by
Berghede Klas
Bought by
Tigerdog Holdings Llc
Current Estimated Value
Home Financials for this Owner
Home Financials are based on the most recent Mortgage that was taken out on this home.
Original Mortgage
$1,035,000
Outstanding Balance
$904,500
Interest Rate
3.7%
Mortgage Type
New Conventional
Estimated Equity
$1,085,001
Purchase Details
Closed on
Mar 10, 2017
Sold by
Michaelcheck Geneva
Bought by
Berghede Klas
Home Financials for this Owner
Home Financials are based on the most recent Mortgage that was taken out on this home.
Original Mortgage
$1,178,265
Interest Rate
3.87%
Mortgage Type
FHA
Purchase Details
Closed on
Feb 23, 2015
Sold by
Mainguy Peter J
Bought by
Michaelcheck Geneva
Purchase Details
Closed on
Aug 5, 1998
Sold by
Brown R L and Brown Ethel
Bought by
Mainguy Peter
Home Financials for this Owner
Home Financials are based on the most recent Mortgage that was taken out on this home.
Original Mortgage
$220,000
Interest Rate
6.91%
Create a Home Valuation Report for This Property
The Home Valuation Report is an in-depth analysis detailing your home's value as well as a comparison with similar homes in the area
Home Values in the Area
Average Home Value in this Area
Purchase History
| Date | Buyer | Sale Price | Title Company |
|---|---|---|---|
| Tigerdog Holdings Llc | $1,725,000 | Chicago Title Company | |
| Berghede Klas | $1,200,000 | Chicago Title Company | |
| Michaelcheck Geneva | $865,000 | Chicago Title Company | |
| Mainguy Peter | $275,000 | First American Title Guarant |
Source: Public Records
Mortgage History
| Date | Status | Borrower | Loan Amount |
|---|---|---|---|
| Open | Tigerdog Holdings Llc | $1,035,000 | |
| Previous Owner | Berghede Klas | $1,178,265 | |
| Previous Owner | Mainguy Peter | $220,000 |
Source: Public Records
Tax History
| Year | Tax Paid | Tax Assessment Tax Assessment Total Assessment is a certain percentage of the fair market value that is determined by local assessors to be the total taxable value of land and additions on the property. | Land | Improvement |
|---|---|---|---|---|
| 2025 | $30,485 | $1,980,667 | $565,953 | $1,414,714 |
| 2024 | $30,485 | $1,941,837 | $554,858 | $1,386,979 |
| 2023 | $29,854 | $1,903,767 | $543,980 | $1,359,787 |
| 2022 | $28,236 | $1,777,715 | $533,314 | $1,244,401 |
| 2021 | $28,299 | $1,742,870 | $522,861 | $1,220,009 |
| 2020 | $26,726 | $1,725,000 | $517,500 | $1,207,500 |
| 2019 | $20,229 | $1,248,480 | $374,544 | $873,936 |
| 2018 | $19,861 | $1,224,000 | $367,200 | $856,800 |
| 2017 | $15,489 | $895,750 | $434,931 | $460,819 |
| 2016 | $14,844 | $878,191 | $426,405 | $451,786 |
| 2015 | $8,439 | $358,704 | $107,611 | $251,093 |
| 2014 | $8,502 | $351,677 | $105,503 | $246,174 |
Source: Public Records
Map
Nearby Homes
- 2324 Browning St
- 2231 Byron St
- 2144 Curtis St
- 1039 Channing Way
- 1142 Dwight Way
- 2327 10th St Unit 4
- 1118 Dwight Way
- 1092 Dwight Way
- 2241 Ninth St
- 931 Bancroft Way
- 1919 Curtis St
- 1578 Allston Way
- 2013 9th St
- 2238 7th St
- 2220 7th St
- 1050 Allston Way
- 1261 Hearst Ave
- 2118 California St
- 1515 Derby St
- 1128 Delaware St
- 2323 Browning St
- 2331 Browning St
- 2319 Browning St
- 2333 Browning St
- 2326 Bonar St
- 2337 Browning St
- 2330 Bonar St
- 2317 Browning St
- 2320 Bonar St
- 2339 Browning St
- 2334 Bonar St
- 2316 Bonar St
- 2332 Browning St
- 2341 Browning St
- 2336 Bonar St
- 2320 Browning St
- 2330 Browning St Unit 2330
- 2328 Browning St
- 2326 Browning St
- 2309 Browning St
Your Personal Tour Guide
Ask me questions while you tour the home.