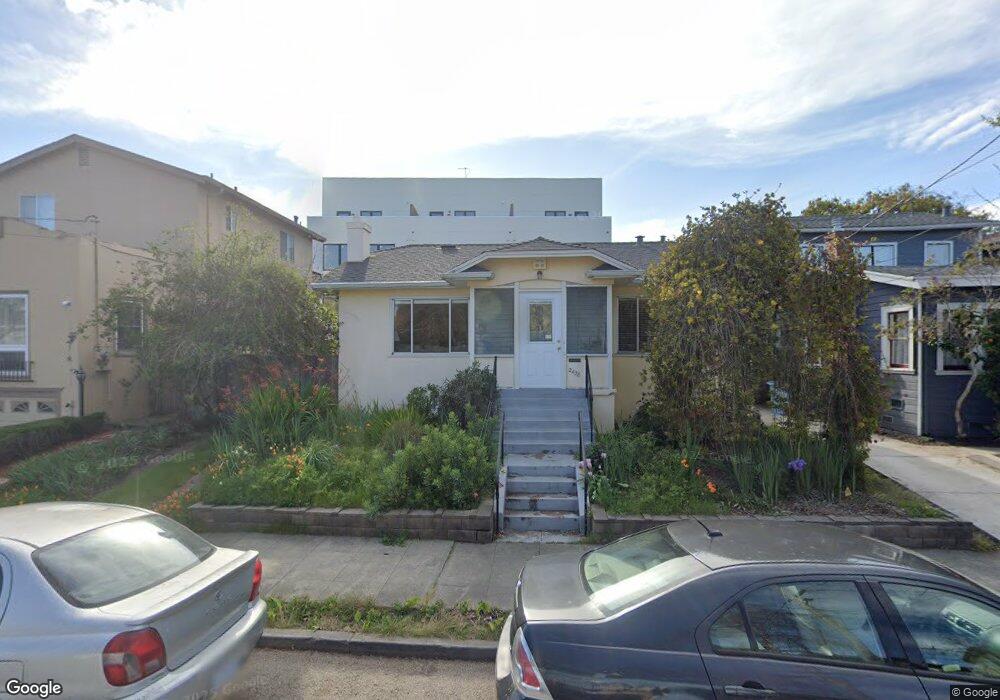
2438 Byron St Berkeley, CA 94702
West Berkeley NeighborhoodEstimated Value: $810,000 - $1,215,000
2
Beds
1
Bath
768
Sq Ft
$1,238/Sq Ft
Est. Value
About This Home
This home is located at 2438 Byron St, Berkeley, CA 94702 and is currently estimated at $950,518, approximately $1,237 per square foot. 2438 Byron St is a home located in Alameda County with nearby schools including Rosa Parks Elementary School, Ruth Acty Elementary, and Berkeley Arts Magnet at Whittier School.
Ownership History
Date
Name
Owned For
Owner Type
Purchase Details
Closed on
Oct 5, 2011
Sold by
Allen Shannon
Bought by
Forman Donald and Roberts Katherine
Current Estimated Value
Home Financials for this Owner
Home Financials are based on the most recent Mortgage that was taken out on this home.
Original Mortgage
$150,000
Outstanding Balance
$14,224
Interest Rate
4.15%
Mortgage Type
New Conventional
Estimated Equity
$936,294
Purchase Details
Closed on
Nov 13, 2002
Sold by
Navaee Amir B
Bought by
Allen Shannon
Home Financials for this Owner
Home Financials are based on the most recent Mortgage that was taken out on this home.
Original Mortgage
$300,000
Interest Rate
5.95%
Purchase Details
Closed on
Jun 12, 2001
Sold by
Welch Sharon E and Estate Of Stephen Krasnor
Bought by
Navaee Amir B
Home Financials for this Owner
Home Financials are based on the most recent Mortgage that was taken out on this home.
Original Mortgage
$203,400
Interest Rate
6.7%
Mortgage Type
Stand Alone First
Create a Home Valuation Report for This Property
The Home Valuation Report is an in-depth analysis detailing your home's value as well as a comparison with similar homes in the area
Home Values in the Area
Average Home Value in this Area
Purchase History
| Date | Buyer | Sale Price | Title Company |
|---|---|---|---|
| Forman Donald | $405,000 | Old Republic Title Company | |
| Allen Shannon | $375,000 | -- | |
| Navaee Amir B | $271,500 | Old Republic Title Company |
Source: Public Records
Mortgage History
| Date | Status | Borrower | Loan Amount |
|---|---|---|---|
| Open | Forman Donald | $150,000 | |
| Previous Owner | Allen Shannon | $300,000 | |
| Previous Owner | Navaee Amir B | $203,400 |
Source: Public Records
Tax History
| Year | Tax Paid | Tax Assessment Tax Assessment Total Assessment is a certain percentage of the fair market value that is determined by local assessors to be the total taxable value of land and additions on the property. | Land | Improvement |
|---|---|---|---|---|
| 2025 | $7,604 | $501,675 | $152,602 | $356,073 |
| 2024 | $7,604 | $491,704 | $149,611 | $349,093 |
| 2023 | $7,445 | $488,927 | $146,678 | $342,249 |
| 2022 | $7,315 | $472,341 | $143,802 | $335,539 |
| 2021 | $7,330 | $462,945 | $140,983 | $328,962 |
| 2020 | $6,965 | $465,130 | $139,539 | $325,591 |
| 2019 | $6,718 | $456,013 | $136,804 | $319,209 |
| 2018 | $6,607 | $447,074 | $134,122 | $312,952 |
| 2017 | $6,354 | $438,310 | $131,493 | $306,817 |
| 2016 | $6,163 | $429,717 | $128,915 | $300,802 |
| 2015 | $6,083 | $423,264 | $126,979 | $296,285 |
| 2014 | $6,046 | $414,974 | $124,492 | $290,482 |
Source: Public Records
Map
Nearby Homes
- 1118 Dwight Way
- 1092 Dwight Way
- 1142 Dwight Way
- 1039 Channing Way
- 2327 10th St Unit 4
- 2324 Browning St
- 2231 Byron St
- 2241 Ninth St
- 931 Bancroft Way
- 2144 Curtis St
- 2238 7th St
- 2747 San Pablo Ave Unit 507
- 1034 Grayson St
- 1010 Grayson St
- 2220 7th St
- 2751 Wallace St
- 1050 Allston Way
- 2013 9th St
- 1450 Ward St
- 1515 Derby St
- 2442 Byron St
- 2434 Byron St
- 2444 Byron St
- 2432 Byron St
- 2435 San Pablo Ave
- 2433 San Pablo Ave
- 2446 Byron St
- 2430 Byron St
- 2429 San Pablo Ave
- 2435 Byron St
- 2426 Byron St
- 2451 Byron St
- 2433 Byron St
- 2427 San Pablo Ave
- 1121 Dwight Way
- 2429 Byron St
- 2424 Byron St
- 2425 San Pablo Ave
- 2423 San Pablo Ave
- 2427 Byron St
Your Personal Tour Guide
Ask me questions while you tour the home.