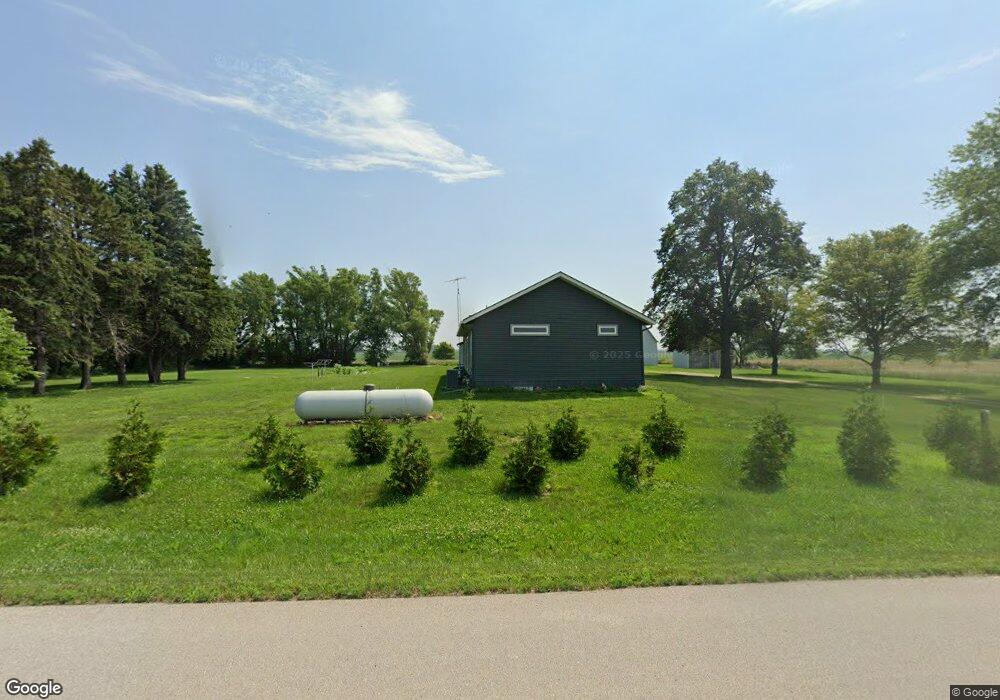
2514 225th Ave Milford, IA 51351
Estimated Value: $561,744 - $698,000
3
Beds
3
Baths
2,016
Sq Ft
$319/Sq Ft
Est. Value
About This Home
This home is located at 2514 225th Ave, Milford, IA 51351 and is currently estimated at $643,436, approximately $319 per square foot. 2514 225th Ave is a home located in Dickinson County with nearby schools including Okoboji Elementary School, Okoboji Middle School, and Okoboji High School.
Ownership History
Date
Name
Owned For
Owner Type
Purchase Details
Closed on
Feb 11, 2022
Sold by
John Laubenthal Ryan and John Paulette Melany
Bought by
Laubenthal Ryan John and Laubenthal Melany Paulette
Current Estimated Value
Home Financials for this Owner
Home Financials are based on the most recent Mortgage that was taken out on this home.
Original Mortgage
$378,000
Outstanding Balance
$350,935
Interest Rate
3.69%
Estimated Equity
$292,501
Purchase Details
Closed on
Oct 21, 2016
Sold by
Hoffrichter Francis J and Hoffrichter Marilyn M
Bought by
Boetel Melany P
Create a Home Valuation Report for This Property
The Home Valuation Report is an in-depth analysis detailing your home's value as well as a comparison with similar homes in the area
Home Values in the Area
Average Home Value in this Area
Purchase History
| Date | Buyer | Sale Price | Title Company |
|---|---|---|---|
| Laubenthal Ryan John | -- | None Listed On Document | |
| Boetel Melany P | $165,000 | None Available |
Source: Public Records
Mortgage History
| Date | Status | Borrower | Loan Amount |
|---|---|---|---|
| Open | Laubenthal Ryan John | $378,000 |
Source: Public Records
Tax History Compared to Growth
Tax History
| Year | Tax Paid | Tax Assessment Tax Assessment Total Assessment is a certain percentage of the fair market value that is determined by local assessors to be the total taxable value of land and additions on the property. | Land | Improvement |
|---|---|---|---|---|
| 2025 | $2,774 | $483,300 | $87,100 | $396,200 |
| 2024 | $2,774 | $378,900 | $83,300 | $295,600 |
| 2023 | $2,732 | $378,900 | $83,300 | $295,600 |
| 2022 | $2,056 | $304,900 | $81,600 | $223,300 |
| 2021 | $2,056 | $240,100 | $81,600 | $158,500 |
| 2020 | $2,060 | $226,300 | $77,700 | $148,600 |
| 2019 | $1,854 | $226,300 | $77,700 | $148,600 |
| 2018 | $1,792 | $209,300 | $70,600 | $138,700 |
| 2017 | $1,792 | $209,300 | $70,600 | $138,700 |
| 2016 | $1,598 | $200,900 | $67,100 | $133,800 |
| 2015 | $1,528 | $200,900 | $67,100 | $133,800 |
| 2014 | $1,400 | $182,200 | $66,500 | $115,700 |
| 2013 | $1,330 | $182,200 | $66,500 | $115,700 |
Source: Public Records
Map
Nearby Homes