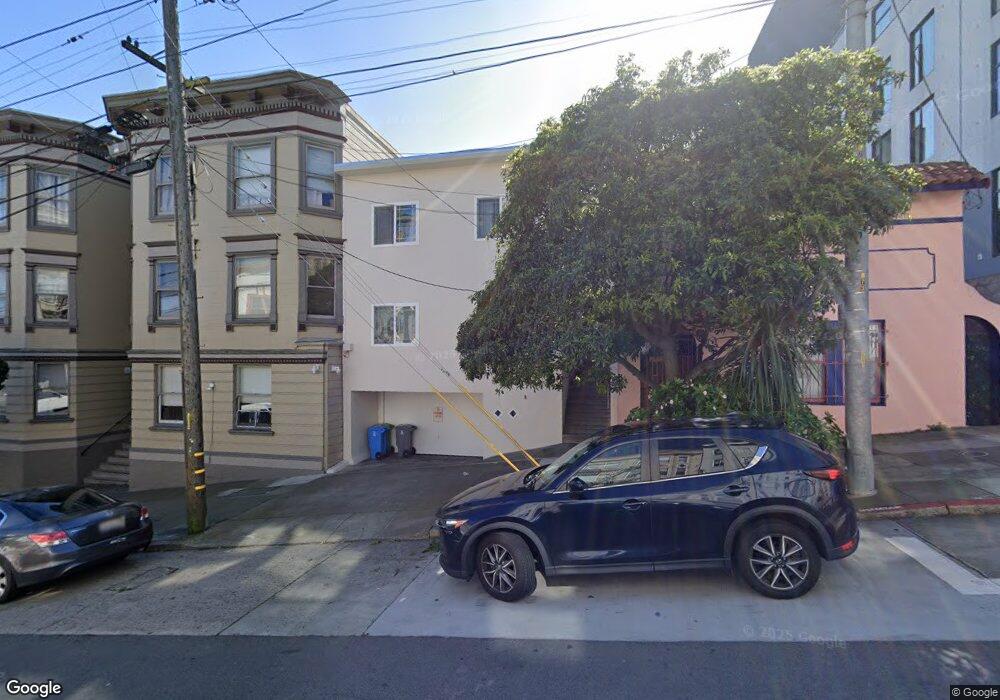
2743 Sutter St Unit 2745 San Francisco, CA 94115
Lower Pacific Heights NeighborhoodEstimated Value: $1,281,000 - $1,835,000
--
Bed
2
Baths
2,200
Sq Ft
$709/Sq Ft
Est. Value
About This Home
This home is located at 2743 Sutter St Unit 2745, San Francisco, CA 94115 and is currently estimated at $1,560,452, approximately $709 per square foot. 2743 Sutter St Unit 2745 is a home located in San Francisco County with nearby schools including Cobb (William L.) Elementary School, Roosevelt Middle School, and San Francisco Day School.
Ownership History
Date
Name
Owned For
Owner Type
Purchase Details
Closed on
Oct 8, 2013
Sold by
Holeman Spencer
Bought by
Holeman Spencer
Current Estimated Value
Purchase Details
Closed on
Dec 2, 2002
Sold by
Lee Chui Sum
Bought by
Lee Chui Sum
Purchase Details
Closed on
Aug 29, 1995
Sold by
Short Hiram and Short Evelyn
Bought by
Lee Chui Sum
Home Financials for this Owner
Home Financials are based on the most recent Mortgage that was taken out on this home.
Original Mortgage
$163,000
Interest Rate
7.88%
Mortgage Type
Commercial
Purchase Details
Closed on
Mar 1, 1994
Sold by
Short Evelyn and Hassan Muneer
Bought by
Short Hiram and Short Evelyn
Purchase Details
Closed on
Dec 22, 1993
Sold by
Hassan Mabel
Bought by
Hassan Muneer
Home Financials for this Owner
Home Financials are based on the most recent Mortgage that was taken out on this home.
Original Mortgage
$62,500
Interest Rate
7.84%
Mortgage Type
Commercial
Create a Home Valuation Report for This Property
The Home Valuation Report is an in-depth analysis detailing your home's value as well as a comparison with similar homes in the area
Home Values in the Area
Average Home Value in this Area
Purchase History
| Date | Buyer | Sale Price | Title Company |
|---|---|---|---|
| Holeman Spencer | -- | None Available | |
| Lee Chui Sum | -- | Fidelity National Title Co | |
| Lee Chui Sum | -- | Fidelity National Title Co | |
| Lee Chui Sum | $263,000 | First American Title Co | |
| Short Hiram | -- | Old Republic Title Company | |
| Hassan Muneer | -- | Old Republic Title Company |
Source: Public Records
Mortgage History
| Date | Status | Borrower | Loan Amount |
|---|---|---|---|
| Closed | Lee Chui Sum | $163,000 | |
| Previous Owner | Hassan Muneer | $62,500 |
Source: Public Records
Tax History Compared to Growth
Tax History
| Year | Tax Paid | Tax Assessment Tax Assessment Total Assessment is a certain percentage of the fair market value that is determined by local assessors to be the total taxable value of land and additions on the property. | Land | Improvement |
|---|---|---|---|---|
| 2025 | $5,807 | $436,884 | $332,239 | $104,645 |
| 2024 | $5,807 | $428,319 | $325,725 | $102,594 |
| 2023 | $5,711 | $419,922 | $319,339 | $100,583 |
| 2022 | $5,996 | $446,158 | $156,546 | $289,612 |
| 2021 | $5,886 | $437,409 | $153,476 | $283,933 |
| 2020 | $6,029 | $432,924 | $151,902 | $281,022 |
| 2019 | $5,829 | $424,436 | $148,924 | $275,512 |
| 2018 | $5,628 | $416,114 | $146,004 | $270,110 |
| 2017 | $5,264 | $407,955 | $143,141 | $264,814 |
| 2016 | $5,148 | $399,956 | $140,334 | $259,622 |
| 2015 | $5,078 | $393,948 | $138,226 | $255,722 |
| 2014 | $4,946 | $386,231 | $135,518 | $250,713 |
Source: Public Records
Map
Nearby Homes
- 1450 Lyon St
- 22 Wood St
- 3014 Pine St
- 3014 Pine St Unit A
- 53 Wood St
- 21 Wood St
- 23 Wood St
- 48 Terra Vista Ave Unit B
- 48 Terra Vista Ave Unit A
- 2978 Pine St
- 84 Fortuna Ave
- 2825 Pine St
- 3100 California St
- 245 Ewing Terrace
- 1819 Lyon St Unit 3
- 1819 Lyon St Unit 1
- 2181 Ofarrell St
- 2655 Bush St Unit 109
- 2655 Bush St Unit 603
- 2655 Bush St Unit 431
- 2755 Sutter St
- 2737 Sutter St
- 2735 Sutter St Unit 2735
- 2731 Sutter St Unit B
- 2731 Sutter St Unit A
- 2725 Sutter St Unit 2729
- 2727 Sutter St
- 2729 Sutter St
- 2719 Sutter St
- 2717 Sutter St
- 2715 Sutter St
- 844 Presidio Ave
- 844 Presidio Ave Unit A
- 2638 Post St
- 2707 Sutter St Unit 2709
- 842 Presidio Ave
- 2646 Post St Unit 1
- 2646 Post St Unit 4
- 2646 Post St Unit 3
- 2646 Post St Unit 2