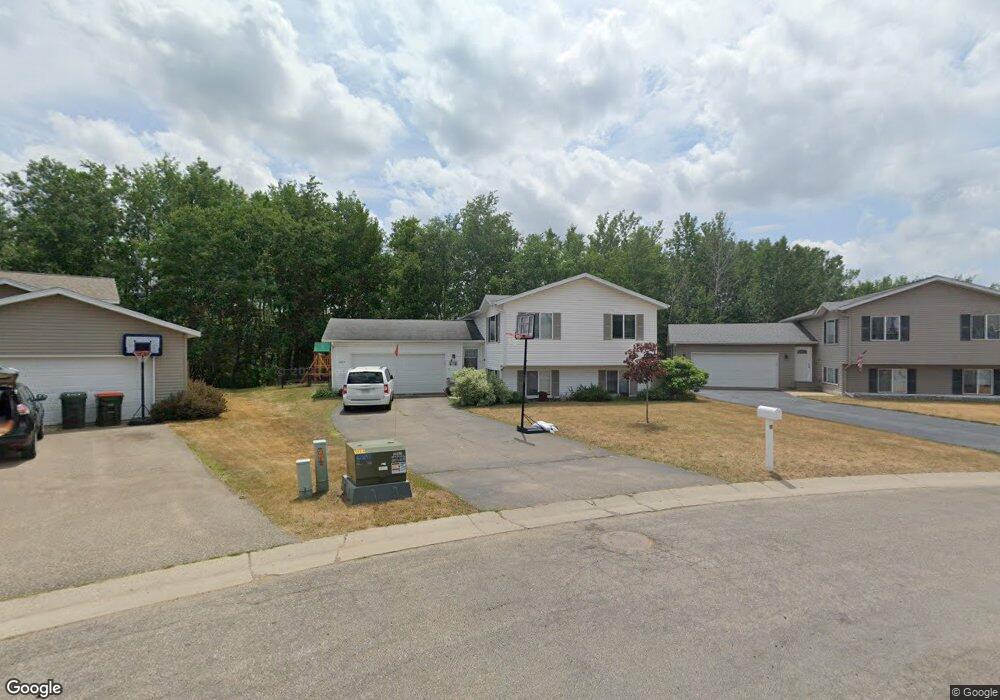
2825 Clara St Brainerd, MN 56401
Estimated Value: $276,000 - $306,000
5
Beds
2
Baths
1,960
Sq Ft
$149/Sq Ft
Est. Value
About This Home
This home is located at 2825 Clara St, Brainerd, MN 56401 and is currently estimated at $292,151, approximately $149 per square foot. 2825 Clara St is a home located in Crow Wing County with nearby schools including Harrison Elementary School, Forestview Middle School, and Brainerd Senior High School.
Ownership History
Date
Name
Owned For
Owner Type
Purchase Details
Closed on
Feb 26, 2021
Sold by
Nieman Monica Monica
Bought by
Svendsen Andrew Andrew
Current Estimated Value
Home Financials for this Owner
Home Financials are based on the most recent Mortgage that was taken out on this home.
Original Mortgage
$215,063
Outstanding Balance
$193,659
Interest Rate
2.97%
Estimated Equity
$98,492
Purchase Details
Closed on
May 29, 2015
Sold by
Przybilla Jeremy Jeremy
Bought by
Nieman Monica
Purchase Details
Closed on
May 1, 2015
Sold by
Przybilla Jeremy and Przybilla Lindsay
Bought by
Nieman Monica
Purchase Details
Closed on
Dec 1, 2010
Sold by
Gruszka Chad J
Bought by
Przybilla Jeremy P and Przybilla Lindsay
Purchase Details
Closed on
Feb 1, 2009
Bought by
Gruszka Chad J
Purchase Details
Closed on
Oct 1, 2002
Bought by
Swenson James and Swenson Jenny
Create a Home Valuation Report for This Property
The Home Valuation Report is an in-depth analysis detailing your home's value as well as a comparison with similar homes in the area
Home Values in the Area
Average Home Value in this Area
Purchase History
| Date | Buyer | Sale Price | Title Company |
|---|---|---|---|
| Svendsen Andrew Andrew | $220,000 | -- | |
| Nieman Monica | $148,500 | -- | |
| Nieman Monica | $148,500 | -- | |
| Przybilla Jeremy P | $115,300 | -- | |
| Gruszka Chad J | $80,000 | -- | |
| Swenson James | $115,500 | -- |
Source: Public Records
Mortgage History
| Date | Status | Borrower | Loan Amount |
|---|---|---|---|
| Open | Svendsen Andrew Andrew | $215,063 |
Source: Public Records
Tax History
| Year | Tax Paid | Tax Assessment Tax Assessment Total Assessment is a certain percentage of the fair market value that is determined by local assessors to be the total taxable value of land and additions on the property. | Land | Improvement |
|---|---|---|---|---|
| 2025 | $2,736 | $247,100 | $44,300 | $202,800 |
| 2024 | $2,736 | $256,100 | $44,200 | $211,900 |
| 2023 | $2,686 | $263,400 | $41,000 | $222,400 |
| 2022 | $2,134 | $234,900 | $32,600 | $202,300 |
| 2021 | $2,174 | $168,800 | $29,600 | $139,200 |
| 2020 | $2,064 | $165,300 | $30,100 | $135,200 |
| 2019 | $1,948 | $152,500 | $30,100 | $122,400 |
| 2018 | $1,732 | $144,500 | $29,900 | $114,600 |
| 2017 | $1,620 | $112,962 | $24,511 | $88,451 |
| 2016 | $1,508 | $98,200 | $19,100 | $79,100 |
| 2015 | $1,360 | $88,400 | $14,700 | $73,700 |
| 2014 | $577 | $81,000 | $13,300 | $67,700 |
Source: Public Records
Map
Nearby Homes
Your Personal Tour Guide
Ask me questions while you tour the home.