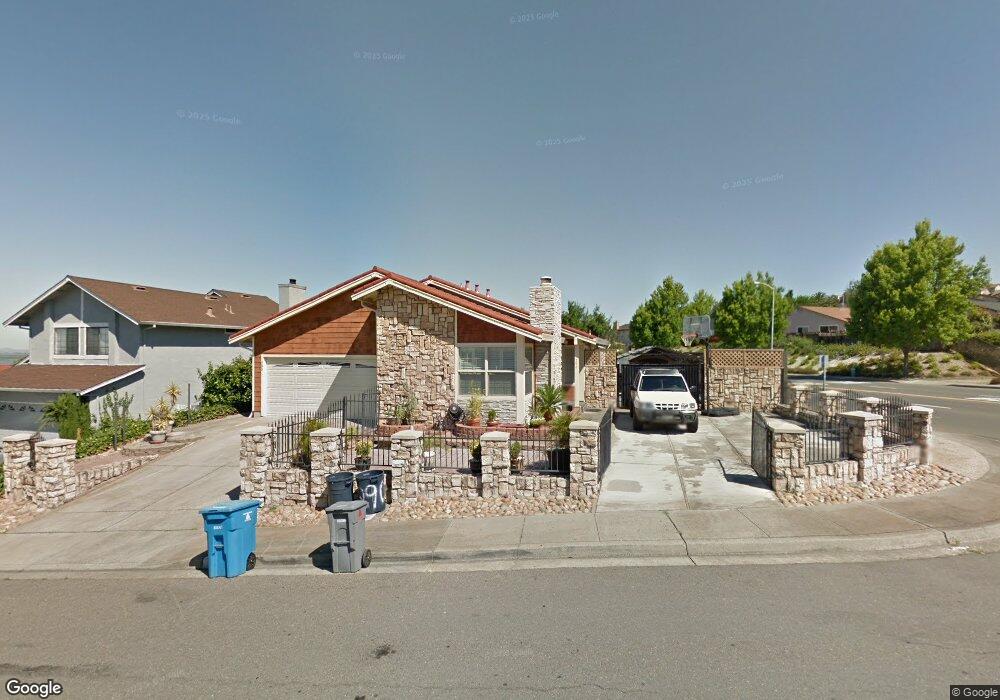
290 Mitchell Ct Vallejo, CA 94589
West Vallejo NeighborhoodEstimated Value: $474,000 - $512,000
3
Beds
2
Baths
1,264
Sq Ft
$396/Sq Ft
Est. Value
About This Home
This home is located at 290 Mitchell Ct, Vallejo, CA 94589 and is currently estimated at $500,139, approximately $395 per square foot. 290 Mitchell Ct is a home located in Solano County with nearby schools including Johnston Cooper Elementary, Vallejo High School, and Elite Public.
Ownership History
Date
Name
Owned For
Owner Type
Purchase Details
Closed on
Feb 23, 2017
Sold by
Narvaza Danny Luis Oreas and Narvaza Alicia Mandal
Bought by
Narvaza Roselyn M
Current Estimated Value
Home Financials for this Owner
Home Financials are based on the most recent Mortgage that was taken out on this home.
Original Mortgage
$337,769
Outstanding Balance
$280,049
Interest Rate
4.25%
Mortgage Type
FHA
Estimated Equity
$220,090
Create a Home Valuation Report for This Property
The Home Valuation Report is an in-depth analysis detailing your home's value as well as a comparison with similar homes in the area
Home Values in the Area
Average Home Value in this Area
Purchase History
| Date | Buyer | Sale Price | Title Company |
|---|---|---|---|
| Narvaza Roselyn M | $344,000 | Old Republic Title Company |
Source: Public Records
Mortgage History
| Date | Status | Borrower | Loan Amount |
|---|---|---|---|
| Open | Narvaza Roselyn M | $337,769 |
Source: Public Records
Tax History
| Year | Tax Paid | Tax Assessment Tax Assessment Total Assessment is a certain percentage of the fair market value that is determined by local assessors to be the total taxable value of land and additions on the property. | Land | Improvement |
|---|---|---|---|---|
| 2025 | $6,325 | $399,234 | $104,449 | $294,785 |
| 2024 | $6,325 | $391,406 | $102,401 | $289,005 |
| 2023 | $6,011 | $383,733 | $100,394 | $283,339 |
| 2022 | $5,911 | $376,210 | $98,426 | $277,784 |
| 2021 | $5,784 | $368,835 | $96,497 | $272,338 |
| 2020 | $5,811 | $365,054 | $95,508 | $269,546 |
| 2019 | $5,653 | $357,897 | $93,636 | $264,261 |
| 2018 | $5,331 | $350,880 | $91,800 | $259,080 |
| 2017 | $3,210 | $204,905 | $42,845 | $162,060 |
| 2016 | $2,631 | $200,888 | $42,005 | $158,883 |
| 2015 | $2,594 | $197,872 | $41,375 | $156,497 |
| 2014 | $2,555 | $193,997 | $40,565 | $153,432 |
Source: Public Records
Map
Nearby Homes
- 519 Holly St
- 355 Parkview Terrace Unit 2
- 355 Parkview Terrace Unit 7
- 355 Parkview Terrace Unit B9
- 355 Parkview Terrace Unit A-8
- 120 Persimmon Dr
- 1333 N Camino Alto Unit 133
- 1333 N Camino Alto Unit 130
- 1333 N Camino Alto Unit 149
- 1333 N Camino Alto None Unit 114
- 165 Oddstad Dr Unit 10
- 165 Oddstad Dr Unit 67
- 240 Parkview Terrace
- 116 Encerti Ave
- 1457 N Camino Alto Unit 214
- 0 Antioch Dr
- 116 Hogan Ave
- 631 Inverness Dr
- 408 Lakeside Dr
- 144 Hogan Ave
Your Personal Tour Guide
Ask me questions while you tour the home.