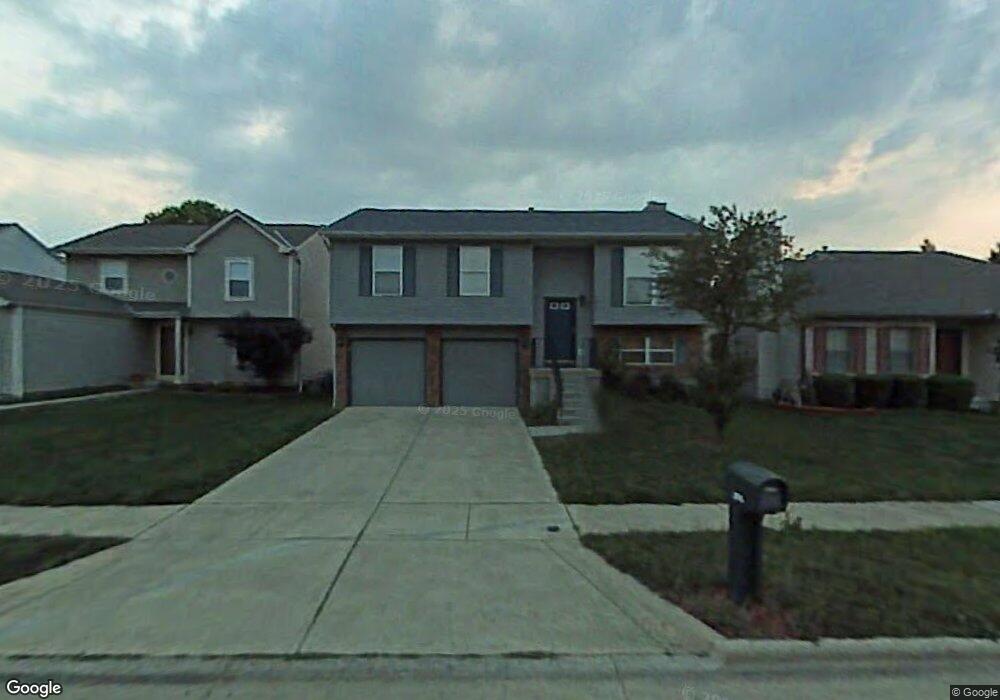
2943 Blue Moon Dr Columbus, OH 43232
Walnut Heights NeighborhoodEstimated Value: $247,000 - $266,000
3
Beds
3
Baths
1,520
Sq Ft
$168/Sq Ft
Est. Value
About This Home
This home is located at 2943 Blue Moon Dr, Columbus, OH 43232 and is currently estimated at $255,784, approximately $168 per square foot. 2943 Blue Moon Dr is a home located in Franklin County with nearby schools including Liberty Elementary School, Yorktown Middle School, and Independence High School.
Ownership History
Date
Name
Owned For
Owner Type
Purchase Details
Closed on
Jun 14, 2007
Sold by
U S Bank Na
Bought by
Johnson Sheryl A
Current Estimated Value
Home Financials for this Owner
Home Financials are based on the most recent Mortgage that was taken out on this home.
Original Mortgage
$105,164
Outstanding Balance
$65,147
Interest Rate
6.42%
Mortgage Type
FHA
Estimated Equity
$190,637
Purchase Details
Closed on
Apr 19, 2007
Sold by
Asse Neal Daniel J and Asse Lehman Brother Structured
Bought by
U S Bank Na
Home Financials for this Owner
Home Financials are based on the most recent Mortgage that was taken out on this home.
Original Mortgage
$105,164
Outstanding Balance
$65,147
Interest Rate
6.42%
Mortgage Type
FHA
Estimated Equity
$190,637
Purchase Details
Closed on
Sep 19, 2005
Sold by
Lunger Lester W
Bought by
Neal Daniel J and Long Vanetta A
Home Financials for this Owner
Home Financials are based on the most recent Mortgage that was taken out on this home.
Original Mortgage
$121,000
Interest Rate
8.75%
Mortgage Type
Fannie Mae Freddie Mac
Purchase Details
Closed on
Sep 24, 1997
Sold by
Crossmann Communities Of Ohio Inc
Bought by
Lunger Lester W
Create a Home Valuation Report for This Property
The Home Valuation Report is an in-depth analysis detailing your home's value as well as a comparison with similar homes in the area
Home Values in the Area
Average Home Value in this Area
Purchase History
| Date | Buyer | Sale Price | Title Company |
|---|---|---|---|
| Johnson Sheryl A | $106,000 | Resource Ti | |
| U S Bank Na | $90,000 | Independent | |
| Neal Daniel J | $121,000 | Chicago Tit | |
| Lunger Lester W | $110,500 | Chicago Title |
Source: Public Records
Mortgage History
| Date | Status | Borrower | Loan Amount |
|---|---|---|---|
| Open | Johnson Sheryl A | $105,164 | |
| Previous Owner | Neal Daniel J | $121,000 |
Source: Public Records
Tax History Compared to Growth
Tax History
| Year | Tax Paid | Tax Assessment Tax Assessment Total Assessment is a certain percentage of the fair market value that is determined by local assessors to be the total taxable value of land and additions on the property. | Land | Improvement |
|---|---|---|---|---|
| 2024 | $3,187 | $71,020 | $16,980 | $54,040 |
| 2023 | $3,147 | $71,015 | $16,975 | $54,040 |
| 2022 | $2,142 | $41,300 | $5,250 | $36,050 |
| 2021 | $2,232 | $41,300 | $5,250 | $36,050 |
| 2020 | $2,149 | $41,300 | $5,250 | $36,050 |
| 2019 | $2,092 | $34,480 | $4,380 | $30,100 |
| 2018 | $1,925 | $34,480 | $4,380 | $30,100 |
| 2017 | $2,090 | $34,480 | $4,380 | $30,100 |
| 2016 | $1,941 | $29,300 | $5,740 | $23,560 |
| 2015 | $1,762 | $29,300 | $5,740 | $23,560 |
| 2014 | $1,766 | $29,300 | $5,740 | $23,560 |
| 2013 | $968 | $32,550 | $6,370 | $26,180 |
Source: Public Records
Map
Nearby Homes
- 2991 Blue Moon Dr
- 2744 Barrows Rd
- 2736 Barrows Rd
- 2730 Raphael Dr
- 5377 Bleaker Ave
- 3057 Lamptonridge Dr
- 5882 Abernathy Ln Unit 5882F
- 3198 Gallant Dr
- 5957 Hollett Dr S
- 5969 Hollett Dr S
- 3148 Aldgate St
- 5936 Abernathy Ln
- 5938 Abernathy Ln
- 5944 Abernathy Ln
- 5946 Abernathy Ln
- 5987 Hollett Dr S
- 5960 Abernathy Ln
- 5962 Abernathy Ln
- 5968 Abernathy Ln
- 5970 Abernathy Ln
- 2951 Blue Moon Dr
- 2935 Blue Moon Dr
- 2959 Blue Moon Dr
- 2967 Blue Moon Dr
- 2919 Blue Moon Dr
- 2940 Blue Moon Dr
- 2948 Blue Moon Dr
- 2932 Blue Moon Dr
- 2975 Blue Moon Dr
- 2911 Blue Moon Dr
- 2924 Blue Moon Dr
- 2964 Blue Moon Dr
- 2916 Blue Moon Dr
- 2972 Blue Moon Dr
- 2983 Blue Moon Dr
- 2903 Blue Moon Dr
- 2908 Blue Moon Dr
- 2980 Blue Moon Dr
- 2941 Fenwood Dr
- 2933 Fenwood Dr