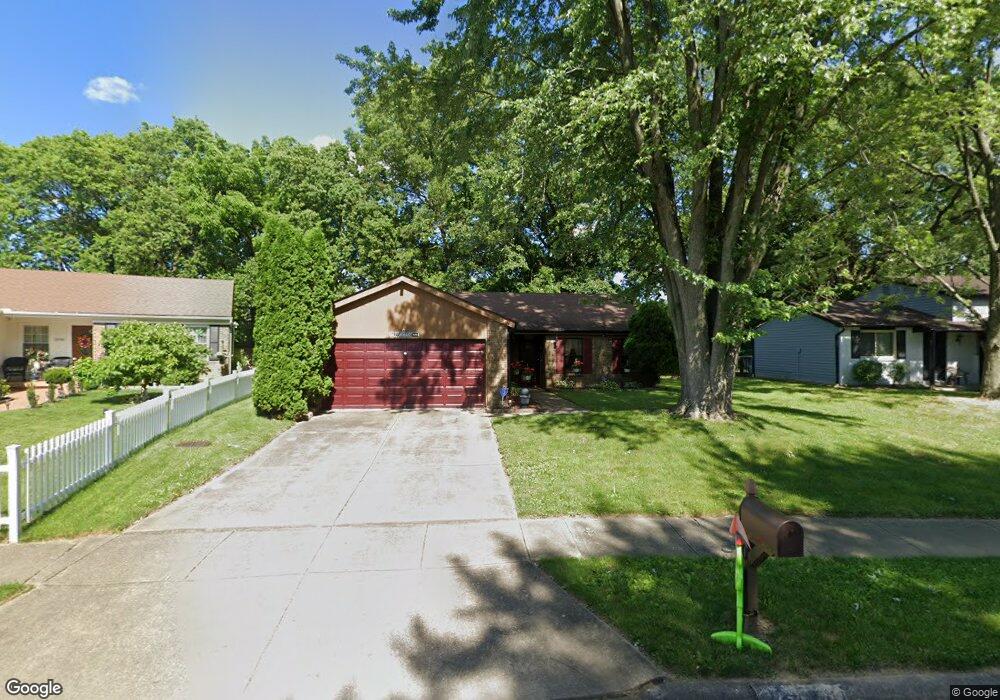
3004 Quinby Dr Columbus, OH 43232
Walnut Heights NeighborhoodEstimated Value: $192,038 - $223,000
3
Beds
1
Bath
1,040
Sq Ft
$204/Sq Ft
Est. Value
About This Home
This home is located at 3004 Quinby Dr, Columbus, OH 43232 and is currently estimated at $211,760, approximately $203 per square foot. 3004 Quinby Dr is a home located in Franklin County with nearby schools including Liberty Elementary School, Yorktown Middle School, and Independence High School.
Ownership History
Date
Name
Owned For
Owner Type
Purchase Details
Closed on
Aug 11, 2021
Sold by
Kopp Delbert R
Bought by
Revocable Trust
Current Estimated Value
Home Financials for this Owner
Home Financials are based on the most recent Mortgage that was taken out on this home.
Original Mortgage
$91,500
Outstanding Balance
$83,022
Interest Rate
2.9%
Mortgage Type
New Conventional
Estimated Equity
$128,738
Purchase Details
Closed on
Jun 30, 2021
Sold by
Kopp David Wesley and Revocable Trust Agmt Of Delber
Bought by
Kopp David W
Home Financials for this Owner
Home Financials are based on the most recent Mortgage that was taken out on this home.
Original Mortgage
$91,500
Outstanding Balance
$83,022
Interest Rate
2.9%
Mortgage Type
New Conventional
Estimated Equity
$128,738
Purchase Details
Closed on
Jan 10, 2008
Sold by
Kopp Delbert R
Bought by
Kopp Delbert R and Revocable Trust Agreement Delb
Purchase Details
Closed on
Oct 27, 1986
Bought by
Kopp Delbert R
Purchase Details
Closed on
Dec 1, 1985
Create a Home Valuation Report for This Property
The Home Valuation Report is an in-depth analysis detailing your home's value as well as a comparison with similar homes in the area
Home Values in the Area
Average Home Value in this Area
Purchase History
| Date | Buyer | Sale Price | Title Company |
|---|---|---|---|
| Revocable Trust | -- | -- | |
| Kopp David W | -- | Heart Of Gold Title | |
| Kopp Delbert R | -- | Attorney | |
| Kopp Delbert R | $56,500 | -- | |
| -- | $54,700 | -- |
Source: Public Records
Mortgage History
| Date | Status | Borrower | Loan Amount |
|---|---|---|---|
| Open | Kopp David W | $91,500 |
Source: Public Records
Tax History Compared to Growth
Tax History
| Year | Tax Paid | Tax Assessment Tax Assessment Total Assessment is a certain percentage of the fair market value that is determined by local assessors to be the total taxable value of land and additions on the property. | Land | Improvement |
|---|---|---|---|---|
| 2024 | $2,584 | $57,580 | $18,690 | $38,890 |
| 2023 | $2,551 | $57,575 | $18,690 | $38,885 |
| 2022 | $1,610 | $31,050 | $6,300 | $24,750 |
| 2021 | $1,613 | $31,050 | $6,300 | $24,750 |
| 2020 | $1,615 | $31,050 | $6,300 | $24,750 |
| 2019 | $1,597 | $26,320 | $5,250 | $21,070 |
| 2018 | $1,283 | $26,320 | $5,250 | $21,070 |
| 2017 | $1,596 | $26,320 | $5,250 | $21,070 |
| 2016 | $1,072 | $24,930 | $5,080 | $19,850 |
| 2015 | $973 | $24,930 | $5,080 | $19,850 |
| 2014 | $975 | $24,930 | $5,080 | $19,850 |
| 2013 | $563 | $27,685 | $5,635 | $22,050 |
Source: Public Records
Map
Nearby Homes
- 2991 Blue Moon Dr
- 5377 Bleaker Ave
- 3198 Gallant Dr
- 3148 Aldgate St
- 5882 Abernathy Ln Unit 5882F
- 2744 Barrows Rd
- 2736 Barrows Rd
- 3057 Lamptonridge Dr
- 5936 Abernathy Ln
- 5938 Abernathy Ln
- 5944 Abernathy Ln
- 5946 Abernathy Ln
- 2730 Raphael Dr
- 5957 Hollett Dr S
- 5960 Abernathy Ln
- 5962 Abernathy Ln
- 5969 Hollett Dr S
- 5968 Abernathy Ln
- 5970 Abernathy Ln
- 5976 Abernathy Ln
- 3012 Quinby Dr
- 2996 Quinby Dr
- 3020 Quinby Dr
- 2990 Quinby Dr
- 5901 Refugee Rd
- 3007 Quinby Dr
- 3028 Quinby Dr
- 2999 Quinby Dr
- 2984 Quinby Dr
- 3015 Quinby Dr
- 3021 Quinby Dr
- 2978 Quinby Dr
- 3036 Quinby Dr
- 3027 Quinby Dr
- 2972 Quinby Dr
- 2988 Perinton Place
- 2996 Perinton Place
- 3044 Quinby Dr
- 3059 Kings Realm Ave
- 3004 Perinton Place