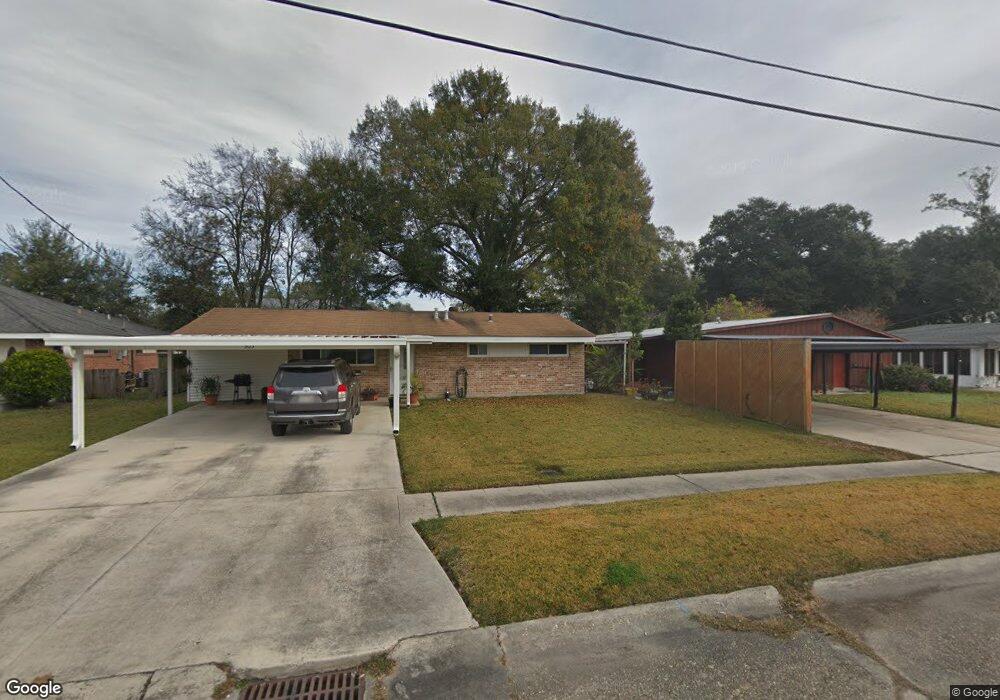
305 Talbot Dr Luling, LA 70070
Estimated Value: $167,643 - $227,000
Studio
--
Bath
1,240
Sq Ft
$161/Sq Ft
Est. Value
About This Home
This home is located at 305 Talbot Dr, Luling, LA 70070 and is currently estimated at $199,911, approximately $161 per square foot. 305 Talbot Dr is a home located in St. Charles Parish with nearby schools including Luling Elementary School, R.K. Smith Middle School, and Hahnville High School.
Ownership History
Date
Name
Owned For
Owner Type
Purchase Details
Closed on
Sep 22, 2006
Sold by
Farrell Gary
Bought by
Leblanc Stephanie Lynn and Hawco Michael J
Current Estimated Value
Home Financials for this Owner
Home Financials are based on the most recent Mortgage that was taken out on this home.
Original Mortgage
$122,900
Outstanding Balance
$71,787
Interest Rate
6.55%
Mortgage Type
New Conventional
Estimated Equity
$128,124
Purchase Details
Closed on
Sep 20, 2006
Sold by
Farrell Patty Crawford
Bought by
Farrell Gary
Home Financials for this Owner
Home Financials are based on the most recent Mortgage that was taken out on this home.
Original Mortgage
$122,900
Outstanding Balance
$71,787
Interest Rate
6.55%
Mortgage Type
New Conventional
Estimated Equity
$128,124
Create a Home Valuation Report for This Property
The Home Valuation Report is an in-depth analysis detailing your home's value as well as a comparison with similar homes in the area
Home Values in the Area
Average Home Value in this Area
Purchase History
| Date | Buyer | Sale Price | Title Company |
|---|---|---|---|
| Leblanc Stephanie Lynn | $124,000 | None Available | |
| Farrell Gary | -- | None Available |
Source: Public Records
Mortgage History
| Date | Status | Borrower | Loan Amount |
|---|---|---|---|
| Open | Leblanc Stephanie Lynn | $122,900 |
Source: Public Records
Tax History
| Year | Tax Paid | Tax Assessment Tax Assessment Total Assessment is a certain percentage of the fair market value that is determined by local assessors to be the total taxable value of land and additions on the property. | Land | Improvement |
|---|---|---|---|---|
| 2025 | $540 | $12,840 | $2,390 | $10,450 |
| 2024 | $540 | $12,840 | $2,390 | $10,450 |
| 2023 | $548 | $10,472 | $2,660 | $7,812 |
| 2022 | $1,225 | $10,472 | $2,660 | $7,812 |
| 2021 | $1,112 | $9,425 | $2,394 | $7,031 |
| 2020 | $1,237 | $10,472 | $2,660 | $7,812 |
| 2019 | $1,105 | $9,320 | $2,500 | $6,820 |
| 2018 | $1,097 | $9,320 | $2,500 | $6,820 |
| 2017 | $1,095 | $9,320 | $2,500 | $6,820 |
| 2016 | $1,100 | $9,320 | $2,500 | $6,820 |
| 2015 | $285 | $9,920 | $1,044 | $8,876 |
| 2014 | $274 | $9,920 | $1,044 | $8,876 |
| 2013 | $275 | $9,920 | $1,044 | $8,876 |
Source: Public Records
Map
Nearby Homes
Your Personal Tour Guide
Ask me questions while you tour the home.