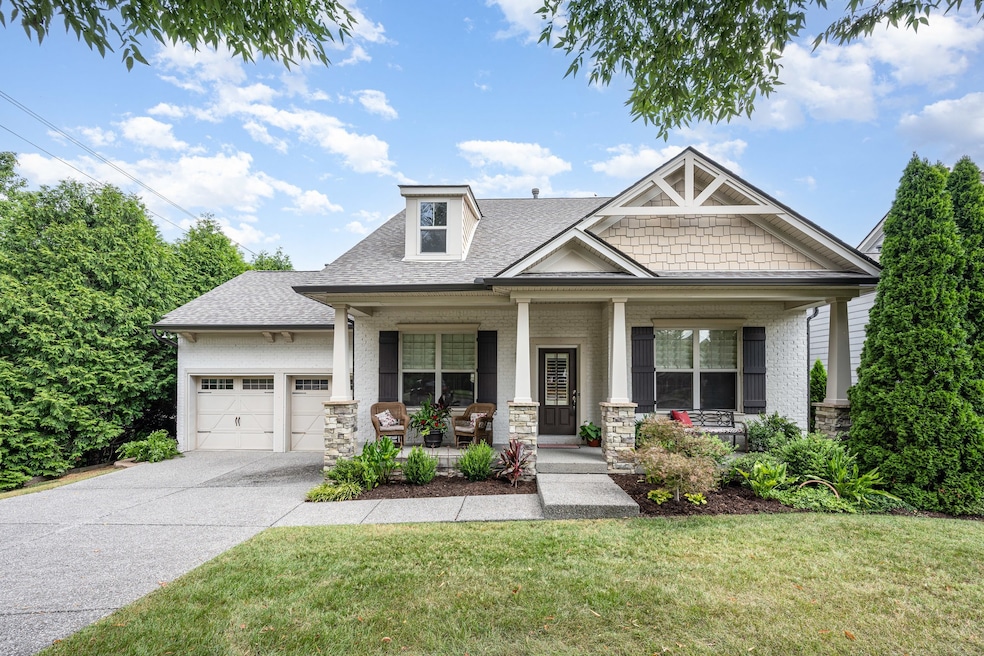
308 Fanchers Ct Franklin, TN 37064
West Franklin NeighborhoodEstimated payment $4,722/month
Highlights
- Open Floorplan
- Contemporary Architecture
- High Ceiling
- Pearre Creek Elementary School Rated A
- Wood Flooring
- Great Room
About This Home
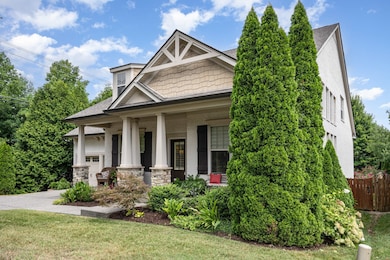
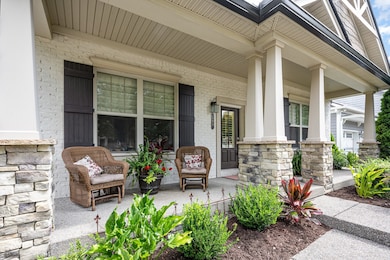
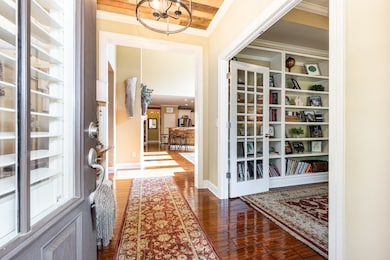
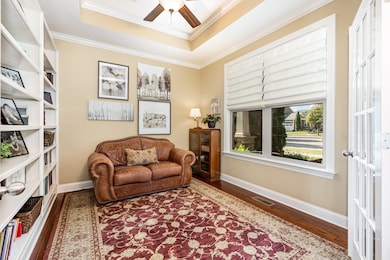
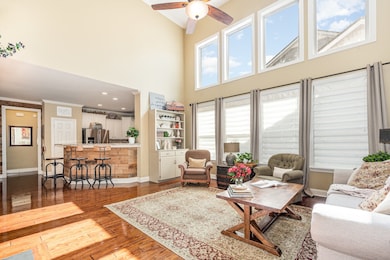
PRICE ADJUSTED!! A Hidden Gem in Franklin! Don’t miss this stunning 3-bedroom, 2-bath home tucked away at the end of a peaceful cul-de-sac in a charming, walkable neighborhood. Just minutes from Historic Downtown Franklin and The Factory, you’ll enjoy easy access to shopping, dining, and entertainment. Step inside to find lots of natural light, fireplace, hardwood floors, granite countertops, and a spacious rec room—perfect for relaxing or entertaining. The covered front porch and back patio offer ideal spots to unwind, while mature trees provide natural privacy in the backyard.
Additional highlights include the roof and gutters replaced in 2024 and thoughtful finishes throughout. This home truly has it all—comfort, character, and convenience.
Listing Agent
Parks Compass Brokerage Phone: 6154266409 License #351020 Listed on: 08/14/2025

Home Details
Home Type
- Single Family
Est. Annual Taxes
- $2,251
Year Built
- Built in 2012
Lot Details
- 7,841 Sq Ft Lot
- Lot Dimensions are 79.4 x 158.1
HOA Fees
- $107 Monthly HOA Fees
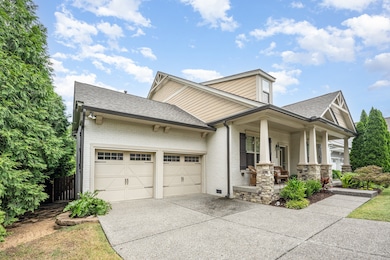
Parking
- 2 Car Attached Garage
- Front Facing Garage
- Garage Door Opener
- Driveway
Home Design
- Contemporary Architecture
- Brick Exterior Construction
- Shingle Roof
Interior Spaces
- 2,395 Sq Ft Home
- Property has 2 Levels
- Open Floorplan
- Built-In Features
- Bookcases
- High Ceiling
- Ceiling Fan
- Entrance Foyer
- Family Room with Fireplace
- Great Room
- Home Office
- Crawl Space
Kitchen
- Gas Oven
- Microwave
- Ice Maker
- Dishwasher
- Stainless Steel Appliances
- Disposal
Flooring
- Wood
- Carpet
- Tile
Bedrooms and Bathrooms
- 3 Bedrooms | 2 Main Level Bedrooms
- Walk-In Closet
- 2 Full Bathrooms
- Double Vanity
Laundry
- Dryer
- Washer
Home Security
- Home Security System
- Carbon Monoxide Detectors
- Fire and Smoke Detector
Outdoor Features
- Covered Patio or Porch
Schools
- Pearre Creek Elementary School
- Hillsboro Elementary/ Middle School
- Independence High School
Utilities
- Central Heating and Cooling System
- High Speed Internet
- Cable TV Available
Community Details
- Barclay Place Subdivision
Listing and Financial Details
- Assessor Parcel Number 094077L G 01100 00005077L
Map
Home Values in the Area
Average Home Value in this Area
Tax History
| Year | Tax Paid | Tax Assessment Tax Assessment Total Assessment is a certain percentage of the fair market value that is determined by local assessors to be the total taxable value of land and additions on the property. | Land | Improvement |
|---|---|---|---|---|
| 2025 | $2,251 | $162,100 | $68,750 | $93,350 |
| 2024 | $2,251 | $104,400 | $32,500 | $71,900 |
| 2023 | $2,251 | $104,400 | $32,500 | $71,900 |
| 2022 | $2,251 | $104,400 | $32,500 | $71,900 |
| 2021 | $2,251 | $104,400 | $32,500 | $71,900 |
| 2020 | $2,237 | $86,800 | $23,750 | $63,050 |
| 2019 | $2,237 | $86,800 | $23,750 | $63,050 |
| 2018 | $2,176 | $86,800 | $23,750 | $63,050 |
| 2017 | $2,159 | $86,800 | $23,750 | $63,050 |
| 2016 | $0 | $86,800 | $23,750 | $63,050 |
| 2015 | -- | $76,350 | $20,000 | $56,350 |
| 2014 | -- | $76,350 | $20,000 | $56,350 |
Property History
| Date | Event | Price | List to Sale | Price per Sq Ft |
|---|---|---|---|---|
| 10/16/2025 10/16/25 | Price Changed | $839,999 | -1.2% | $351 / Sq Ft |
| 09/18/2025 09/18/25 | Price Changed | $849,999 | -1.7% | $355 / Sq Ft |
| 08/14/2025 08/14/25 | For Sale | $864,999 | -- | $361 / Sq Ft |
Purchase History
| Date | Type | Sale Price | Title Company |
|---|---|---|---|
| Interfamily Deed Transfer | -- | None Available | |
| Warranty Deed | $321,129 | -- | |
| Warranty Deed | $763,300 | Southland Title & Escrow Co |
Mortgage History
| Date | Status | Loan Amount | Loan Type |
|---|---|---|---|
| Open | $287,600 | New Conventional |
Source: Realtracs
MLS Number: 2965675
APN: 077L-G-011.00
Disclaimer: Certain information contained herein is derived from information provided by parties other than Homes.com. All information provided is deemed reliable, but is not guaranteed to be accurate and should be independently verified.
![]() Based on information submitted to the MLS GRID. All data is obtained from various sources and may not have been verified by broker or MLS GRID. Supplied Open House Information is subject to change without notice. All information should be independently reviewed and verified for accuracy. Properties may or may not be listed by the office/agent presenting the information. Some IDX listings have been excluded from this website.
Based on information submitted to the MLS GRID. All data is obtained from various sources and may not have been verified by broker or MLS GRID. Supplied Open House Information is subject to change without notice. All information should be independently reviewed and verified for accuracy. Properties may or may not be listed by the office/agent presenting the information. Some IDX listings have been excluded from this website.
The Digital Millennium Copyright Act of 1998, 17 U.S.C. § 512 (the “DMCA”) provides recourse for copyright owners who believe that material appearing on the Internet infringes their rights under U.S. copyright law. If you believe in good faith that any content or material made available in connection with our website or services infringes your copyright, you (or your agent) may send us a notice requesting that the content or material be removed, or access to it blocked.
Notices must be sent in writing by email to DMCAnotice@MLSGrid.com.
The DMCA requires that your notice of alleged copyright infringement include the following information:
(1) description of the copyrighted work that is the subject of claimed infringement;
(2) description of the alleged infringing content and information sufficient to permit us to locate the content;
(3) contact information for you, including your address, telephone number and email address;
(4) a statement by you that you have a good faith belief that the content in the manner complained of is not authorized by the copyright owner, or its agent, or by the operation of any law;
(5) a statement by you, signed under penalty of perjury, that the information in the notification is accurate and that you have the authority to enforce the copyrights that are claimed to be infringed; and
(6) a physical or electronic signature of the copyright owner or a person authorized to act on the copyright owner’s behalf. Failure to include all of the above information may result in the delay of the processing of your complaint.
- 309 Fanchers Ct
- 522 Dabney Dr
- 2001 Barclay Ln
- 413 Verandah Ln
- 640 Springlake Dr
- 203 Scruggs Ave
- 1325 Mallard Dr
- 3186 Horton Ct
- 115 Bradford Dr
- 316 Whitewater Way
- 108 Dabney Dr
- 101 Dabney Dr
- 1101 Downs Blvd Unit 109
- 1101 Downs Blvd Unit 147
- 1101 Downs Blvd Unit K101
- 1101 Downs Blvd Unit 267
- 1101 Downs Blvd Unit 209
- 1101 Downs Blvd Unit 312
- 1101 Downs Blvd Unit B101
- 1101 Downs Blvd Unit 94
- 1101 Downs Blvd Unit 117
- 110 Velena St
- 1718 W Main St
- 3221 Calvin Ct
- 3218 Boyd Mill Ave
- 7209 Bonterra Dr
- 5079 Donovan St
- 503 Figuers Dr
- 601 Boyd Mill Ave Unit C1
- 601 Boyd Mill Ave
- 911 Jewell Ave
- 418 Boyd Mill Ave
- 1129 W Main St Unit 1
- 202 Harris Ct
- 333 11th Ave N
- 373 Byron Way
- 193 Acadia Ave
- 615 Cheltenham Ave
- 1141 Carter St
- 207 Fairground St Unit 103