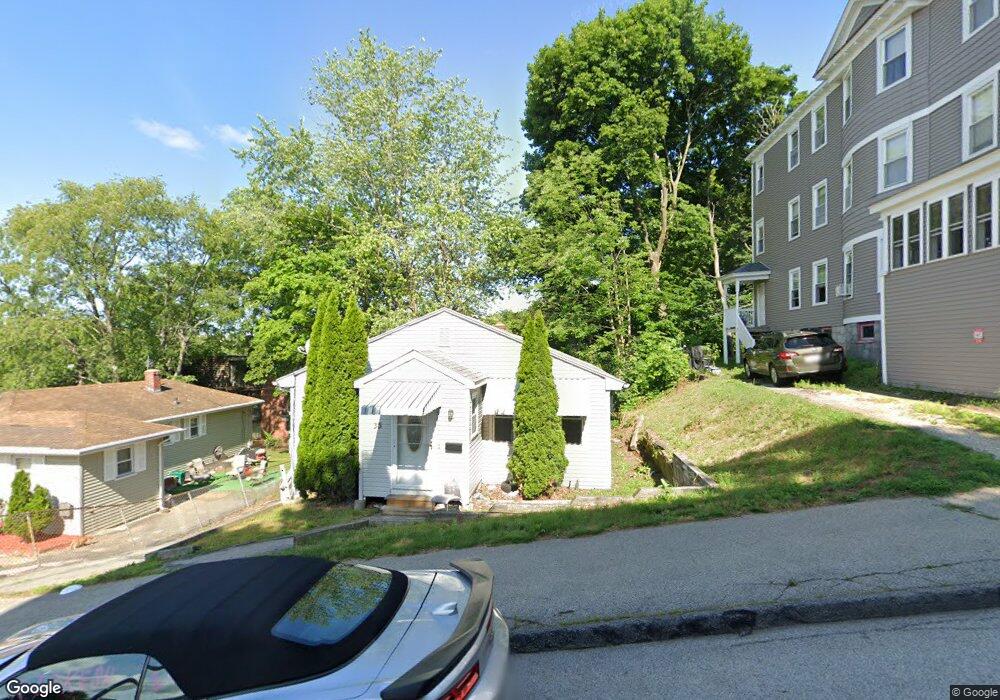
35 Louise St Worcester, MA 01607
Vernon Hill NeighborhoodEstimated Value: $258,000 - $347,000
2
Beds
1
Bath
907
Sq Ft
$332/Sq Ft
Est. Value
About This Home
This home is located at 35 Louise St, Worcester, MA 01607 and is currently estimated at $300,764, approximately $331 per square foot. 35 Louise St is a home located in Worcester County with nearby schools including Vernon Hill Elementary School, Jacob Hiatt Magnet School, and Chandler Magnet.
Ownership History
Date
Name
Owned For
Owner Type
Purchase Details
Closed on
Jul 9, 2009
Sold by
Bac Home Loans Svcng L
Bought by
Aponsah Michael
Current Estimated Value
Home Financials for this Owner
Home Financials are based on the most recent Mortgage that was taken out on this home.
Original Mortgage
$88,369
Outstanding Balance
$56,551
Interest Rate
4.93%
Mortgage Type
Purchase Money Mortgage
Estimated Equity
$244,213
Purchase Details
Closed on
Nov 18, 2008
Sold by
Suarez Elizabeth
Bought by
Bank Of New York
Purchase Details
Closed on
Jun 30, 2004
Sold by
Berry Edward J and Berry Patricia M
Bought by
Suarez Elizabeth and Soto Misael
Home Financials for this Owner
Home Financials are based on the most recent Mortgage that was taken out on this home.
Original Mortgage
$167,275
Interest Rate
6.3%
Mortgage Type
Purchase Money Mortgage
Create a Home Valuation Report for This Property
The Home Valuation Report is an in-depth analysis detailing your home's value as well as a comparison with similar homes in the area
Home Values in the Area
Average Home Value in this Area
Purchase History
| Date | Buyer | Sale Price | Title Company |
|---|---|---|---|
| Aponsah Michael | $90,000 | -- | |
| Bank Of New York | $122,000 | -- | |
| Suarez Elizabeth | $169,900 | -- |
Source: Public Records
Mortgage History
| Date | Status | Borrower | Loan Amount |
|---|---|---|---|
| Open | Aponsah Michael | $88,369 | |
| Previous Owner | Suarez Elizabeth | $167,275 |
Source: Public Records
Tax History Compared to Growth
Tax History
| Year | Tax Paid | Tax Assessment Tax Assessment Total Assessment is a certain percentage of the fair market value that is determined by local assessors to be the total taxable value of land and additions on the property. | Land | Improvement |
|---|---|---|---|---|
| 2025 | $2,605 | $197,500 | $81,200 | $116,300 |
| 2024 | $2,571 | $187,000 | $81,200 | $105,800 |
| 2023 | $2,551 | $177,900 | $70,600 | $107,300 |
| 2022 | $2,247 | $147,700 | $56,500 | $91,200 |
| 2021 | $2,291 | $140,700 | $45,200 | $95,500 |
| 2020 | $2,207 | $129,800 | $44,900 | $84,900 |
| 2019 | $2,137 | $118,700 | $39,200 | $79,500 |
| 2018 | $2,074 | $109,700 | $39,200 | $70,500 |
| 2017 | $2,076 | $108,000 | $39,200 | $68,800 |
| 2016 | $2,036 | $98,800 | $28,300 | $70,500 |
| 2015 | $1,983 | $98,800 | $28,300 | $70,500 |
| 2014 | $1,931 | $98,800 | $28,300 | $70,500 |
Source: Public Records
Map
Nearby Homes
- 32 Ames St
- Lot 1 Stockton St
- 78 Harlem St
- 26 Maxwell St
- 70 Sterling St
- 16 Hillside St
- 96 Vernon St
- 145 Loxwood St
- 8 Taunton St
- 42 Bridgeport St
- 58 Granite St
- 10 Rutledge St Unit 3G
- 9 Winthrop St
- 7 Winthrop St
- 26 Derby St
- 607 Cambridge St Unit 4
- 11 Gibbs St Unit 12
- 17 Riley St
- 49 Richland St
- 17 Thenius St