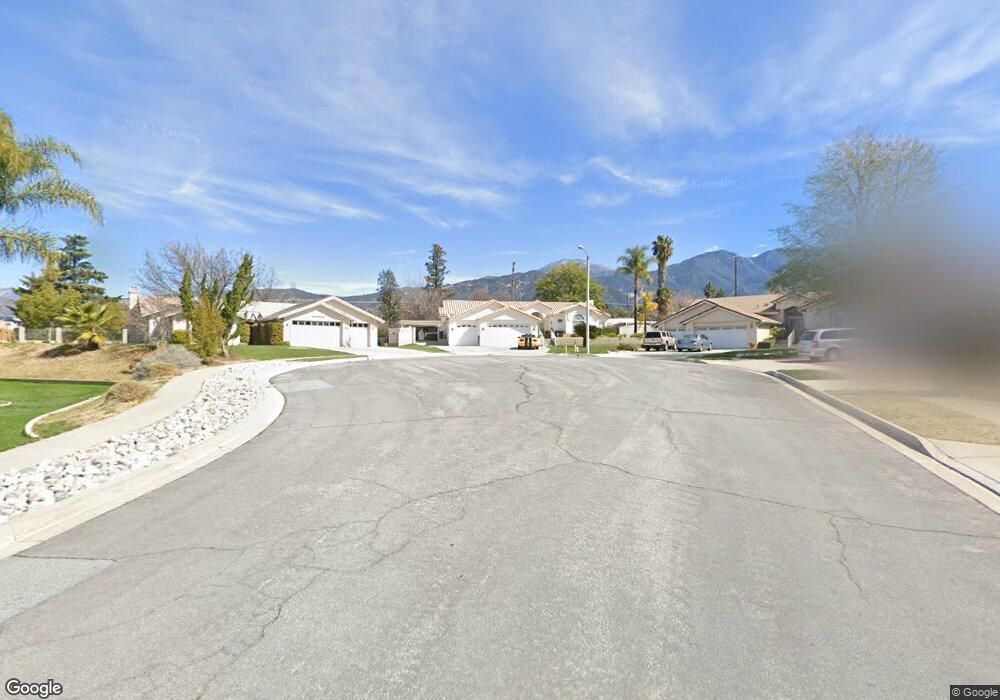
35672 Sutter Ct Yucaipa, CA 92399
Estimated Value: $704,000 - $787,000
4
Beds
3
Baths
2,187
Sq Ft
$341/Sq Ft
Est. Value
About This Home
This home is located at 35672 Sutter Ct, Yucaipa, CA 92399 and is currently estimated at $744,885, approximately $340 per square foot. 35672 Sutter Ct is a home located in San Bernardino County with nearby schools including Ridgeview Elementary School, Park View Middle School, and Yucaipa High School.
Ownership History
Date
Name
Owned For
Owner Type
Purchase Details
Closed on
Dec 1, 2016
Sold by
Smith Ralph C
Bought by
Massanet Juan E and Massanet Anais
Current Estimated Value
Purchase Details
Closed on
May 2, 2002
Sold by
Johnson Lloyd A
Bought by
Smith Ralph C and Smith Carol A
Home Financials for this Owner
Home Financials are based on the most recent Mortgage that was taken out on this home.
Original Mortgage
$197,400
Interest Rate
6.74%
Purchase Details
Closed on
Feb 26, 2001
Sold by
Thompson James Michael
Bought by
Johnson Lloyd A and Johnson Betty E
Purchase Details
Closed on
Dec 7, 1994
Sold by
Reykdal Daryl C
Bought by
Thompson James Michael and Thompson Michelle Lynn
Home Financials for this Owner
Home Financials are based on the most recent Mortgage that was taken out on this home.
Original Mortgage
$150,000
Interest Rate
6.62%
Purchase Details
Closed on
Feb 8, 1994
Sold by
Mm & Jm Development Inc
Bought by
Reykdal Daryl C and Reykdal Barbara A
Create a Home Valuation Report for This Property
The Home Valuation Report is an in-depth analysis detailing your home's value as well as a comparison with similar homes in the area
Home Values in the Area
Average Home Value in this Area
Purchase History
| Date | Buyer | Sale Price | Title Company |
|---|---|---|---|
| Massanet Juan E | $575,000 | Lawyers Title | |
| Smith Ralph C | $282,000 | Chicago Title Co | |
| Johnson Lloyd A | $268,000 | Stewart Title | |
| Thompson James Michael | $229,000 | Commonwealth Land Title Co | |
| Reykdal Daryl C | $62,000 | Union Land Title Company |
Source: Public Records
Mortgage History
| Date | Status | Borrower | Loan Amount |
|---|---|---|---|
| Previous Owner | Smith Ralph C | $197,400 | |
| Previous Owner | Thompson James Michael | $150,000 |
Source: Public Records
Tax History
| Year | Tax Paid | Tax Assessment Tax Assessment Total Assessment is a certain percentage of the fair market value that is determined by local assessors to be the total taxable value of land and additions on the property. | Land | Improvement |
|---|---|---|---|---|
| 2025 | $8,382 | $680,102 | $200,201 | $479,901 |
| 2024 | $8,132 | $666,766 | $196,275 | $470,491 |
| 2023 | $8,008 | $653,692 | $192,426 | $461,266 |
| 2022 | $7,898 | $640,875 | $188,653 | $452,222 |
| 2021 | $7,780 | $628,309 | $184,954 | $443,355 |
| 2020 | $7,483 | $621,867 | $183,058 | $438,809 |
| 2019 | $7,615 | $609,674 | $179,469 | $430,205 |
| 2018 | $7,106 | $597,720 | $175,950 | $421,770 |
| 2017 | $7,033 | $575,000 | $172,500 | $402,500 |
| 2016 | $4,762 | $381,831 | $87,981 | $293,850 |
| 2015 | $4,712 | $376,095 | $86,659 | $289,436 |
| 2014 | $4,143 | $329,000 | $99,000 | $230,000 |
Source: Public Records
Map
Nearby Homes
- 35688 Date Ave
- 35688 Date St
- 9813 Fremont St
- 11675 Calvin St
- 35617 Panorama Dr
- 11758 Grant St
- 35750 Panorama Dr
- 35850 Cornell Dr
- 11630 Lennox St
- 11636 Madison St
- 11606 Madison St
- 35656 Crestview Dr
- 12055 Douglas St
- 0 Pendleton Unit SW24186609
- 11537 Pendleton Rd
- 36041 Highland Ave
- 35263 Beech Ave
- 12151 Fremont St Unit 47
- 35225 Acacia Ave
- 12142 Bryant St
- 35671 Sutter Ct
- 35654 Sutter Ct
- 35665 Date St
- 35651 Date St
- 11744 Fremont St
- 11742 Fremont St
- 35651 Date Ave
- 35657 Sutter Ct
- 35679 Date St
- 35639 Date St
- 35636 Sutter Ct
- 11731 Sutter Ave
- 35681 Date Ave
- 35681 Date St
- 35643 Sutter Ct
- 35625 Date St
- 11747 Sutter Ave
- 11770 Fremont St
- 35629 Sutter Ct
- 35720 Fremont Ct
Your Personal Tour Guide
Ask me questions while you tour the home.