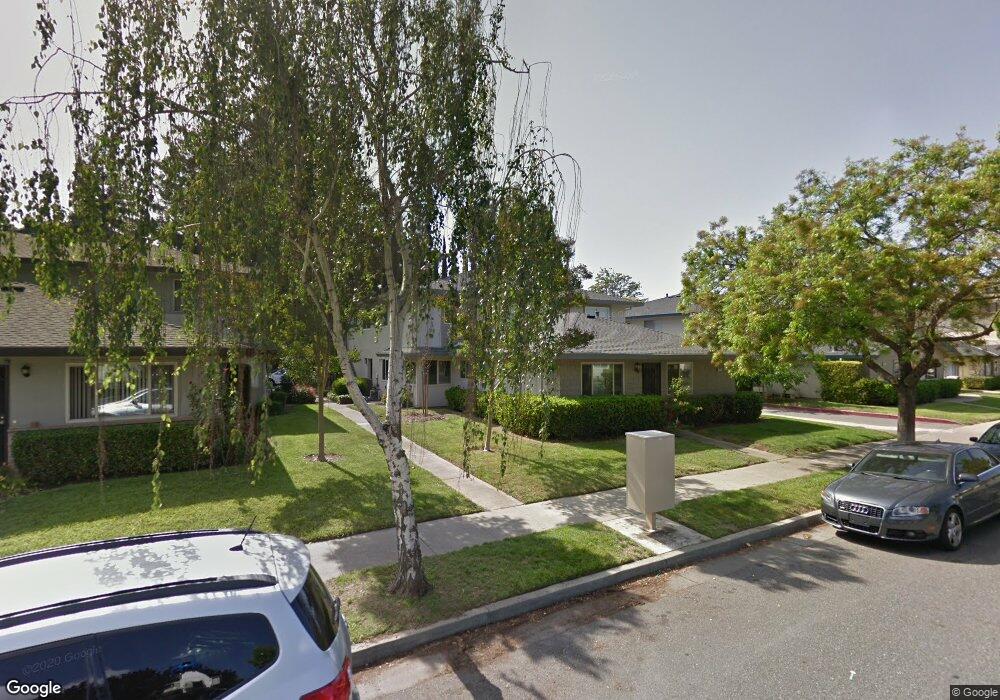
375 N 3rd St Unit 2 Campbell, CA 95008
Downtown Campbell NeighborhoodEstimated Value: $631,000 - $802,000
2
Beds
1
Bath
903
Sq Ft
$785/Sq Ft
Est. Value
About This Home
This home is located at 375 N 3rd St Unit 2, Campbell, CA 95008 and is currently estimated at $708,916, approximately $785 per square foot. 375 N 3rd St Unit 2 is a home located in Santa Clara County with nearby schools including Rosemary Elementary School, Del Mar High School, and Campbell School of Innovation.
Ownership History
Date
Name
Owned For
Owner Type
Purchase Details
Closed on
Nov 23, 2020
Sold by
Thanh Le Liem and Bach Hoa
Bought by
Le Family Living Trust and Le
Current Estimated Value
Home Financials for this Owner
Home Financials are based on the most recent Mortgage that was taken out on this home.
Original Mortgage
$306,000
Outstanding Balance
$246,910
Interest Rate
2.8%
Mortgage Type
New Conventional
Estimated Equity
$462,006
Purchase Details
Closed on
Nov 21, 2020
Sold by
Le Liem Thanh and Le Hoa Thi
Bought by
Thanh Le Liem and Lien Le Hoa
Home Financials for this Owner
Home Financials are based on the most recent Mortgage that was taken out on this home.
Original Mortgage
$306,000
Outstanding Balance
$246,910
Interest Rate
2.8%
Mortgage Type
New Conventional
Estimated Equity
$462,006
Purchase Details
Closed on
Dec 11, 2018
Sold by
Le Liem Thanh and Bach Lien Le Hoa Thi
Bought by
Le Liem Thanh and Bach Lien Le Hoa Thi
Home Financials for this Owner
Home Financials are based on the most recent Mortgage that was taken out on this home.
Original Mortgage
$333,000
Interest Rate
4.8%
Mortgage Type
New Conventional
Purchase Details
Closed on
Oct 3, 2016
Sold by
Le Liem T and Le Hoa T
Bought by
Le Liem Thanh and Le Hoa Thi Bach Lien
Purchase Details
Closed on
Feb 20, 2004
Sold by
Scott Michael D
Bought by
Le Liem T and Le Hoa T
Home Financials for this Owner
Home Financials are based on the most recent Mortgage that was taken out on this home.
Original Mortgage
$217,520
Interest Rate
5.69%
Mortgage Type
Purchase Money Mortgage
Purchase Details
Closed on
Sep 23, 2002
Sold by
Scott Christina M
Bought by
Scott Michael D
Home Financials for this Owner
Home Financials are based on the most recent Mortgage that was taken out on this home.
Original Mortgage
$261,000
Interest Rate
8.4%
Purchase Details
Closed on
Oct 18, 2000
Sold by
Scott Michael D and Thurrott Christina M
Bought by
Scott Michael D and Scott Christina M
Home Financials for this Owner
Home Financials are based on the most recent Mortgage that was taken out on this home.
Original Mortgage
$60,000
Interest Rate
7.96%
Mortgage Type
Credit Line Revolving
Purchase Details
Closed on
Sep 10, 1998
Sold by
Jackson Jackie L
Bought by
Scott Michael D and Thurrott Christina M
Home Financials for this Owner
Home Financials are based on the most recent Mortgage that was taken out on this home.
Original Mortgage
$150,750
Interest Rate
6.89%
Mortgage Type
FHA
Create a Home Valuation Report for This Property
The Home Valuation Report is an in-depth analysis detailing your home's value as well as a comparison with similar homes in the area
Home Values in the Area
Average Home Value in this Area
Purchase History
| Date | Buyer | Sale Price | Title Company |
|---|---|---|---|
| Le Family Living Trust | -- | Accommodation/Courtesy Recordi | |
| Thanh Le Liem | -- | Accommodation | |
| Le Liem Thanh | -- | Wfg National Title | |
| Le Liem Thanh | -- | Accommodation | |
| Bach Le Liem Thanh | -- | Wfg Natl Title Ins Co | |
| Le Liem Thanh | -- | None Available | |
| Le Liem T | $283,000 | Alliance Title Company | |
| Scott Michael D | -- | Alliance Title Company | |
| Scott Michael D | -- | First American Title Co | |
| Scott Michael D | $160,000 | Fidelity National Title Co |
Source: Public Records
Mortgage History
| Date | Status | Borrower | Loan Amount |
|---|---|---|---|
| Open | Le Liem Thanh | $306,000 | |
| Previous Owner | Bach Le Liem Thanh | $333,000 | |
| Previous Owner | Le Liem T | $217,520 | |
| Previous Owner | Scott Michael D | $261,000 | |
| Previous Owner | Scott Michael D | $60,000 | |
| Previous Owner | Scott Michael D | $150,750 | |
| Closed | Le Liem T | $25,000 |
Source: Public Records
Tax History
| Year | Tax Paid | Tax Assessment Tax Assessment Total Assessment is a certain percentage of the fair market value that is determined by local assessors to be the total taxable value of land and additions on the property. | Land | Improvement |
|---|---|---|---|---|
| 2025 | $5,674 | $401,989 | $71,078 | $330,911 |
| 2024 | $5,674 | $394,108 | $69,685 | $324,423 |
| 2023 | $5,604 | $386,381 | $68,319 | $318,062 |
| 2022 | $5,617 | $378,806 | $66,980 | $311,826 |
| 2021 | $5,503 | $371,379 | $65,667 | $305,712 |
| 2020 | $5,350 | $367,572 | $64,994 | $302,578 |
| 2019 | $5,264 | $360,366 | $63,720 | $296,646 |
| 2018 | $5,097 | $353,301 | $62,471 | $290,830 |
| 2017 | $5,013 | $346,375 | $61,247 | $285,128 |
| 2016 | $4,628 | $339,585 | $60,047 | $279,538 |
| 2015 | $4,530 | $334,486 | $59,146 | $275,340 |
| 2014 | $4,320 | $327,935 | $57,988 | $269,947 |
Source: Public Records
Map
Nearby Homes
- 283 Esther Ave
- 350 N 1st St Unit 3
- 1481 Pompey Dr
- 1454 Merry Ln
- 77 S 1st St
- 110 S 1st St Unit 110
- 3364 Merrimac Dr
- 87 Salice Way
- 289 Llewellyn Ave Unit 18-18 - Plan 1
- 289 Llewellyn Ave Unit 17-18 - Plan 2
- 285 Llewellyn Ave Unit 16-18 Plan 2
- 281 Llewellyn Ave Unit 14-18 - Plan 2
- 466 Sam Cava Ln
- 271 Wagon Way Unit 38-03 - Plan 4
- 273 Llewellyn Ave Unit 10-18 Plan 2
- 291 Wagon Way Unit 28-02 - Plan 6
- 289 Wagon Way Unit 27-02 - Plan 2
- 289 Wagon Way Unit 29-02 - Plan 3
- 287 Wagon Way Unit 30-02 Plan 4
- 283 Wagon Way Unit 32-02 Plan 5
- 375 N 3rd St Unit 4
- 375 N 3rd St Unit 3
- 375 N 3rd St Unit 1
- 385 N 3rd St Unit 4
- 385 N 3rd St Unit 3
- 385 N 3rd St Unit 2
- 385 N 3rd St Unit 1
- 365 N 3rd St Unit 2
- 365 N 3rd St
- 365 N 3rd St Unit 4
- 365 N 3rd St Unit 3
- 365 N 3rd St Unit 2
- 365 N 3rd St Unit 1
- 395 N 3rd St Unit 4
- 395 N 3rd St Unit 3
- 395 N 3rd St Unit 2
- 395 N 3rd St Unit 1
- 355 N 3rd St Unit 3
- 355 N 3rd St Unit 4
- 355 N 3rd St Unit 3
Your Personal Tour Guide
Ask me questions while you tour the home.