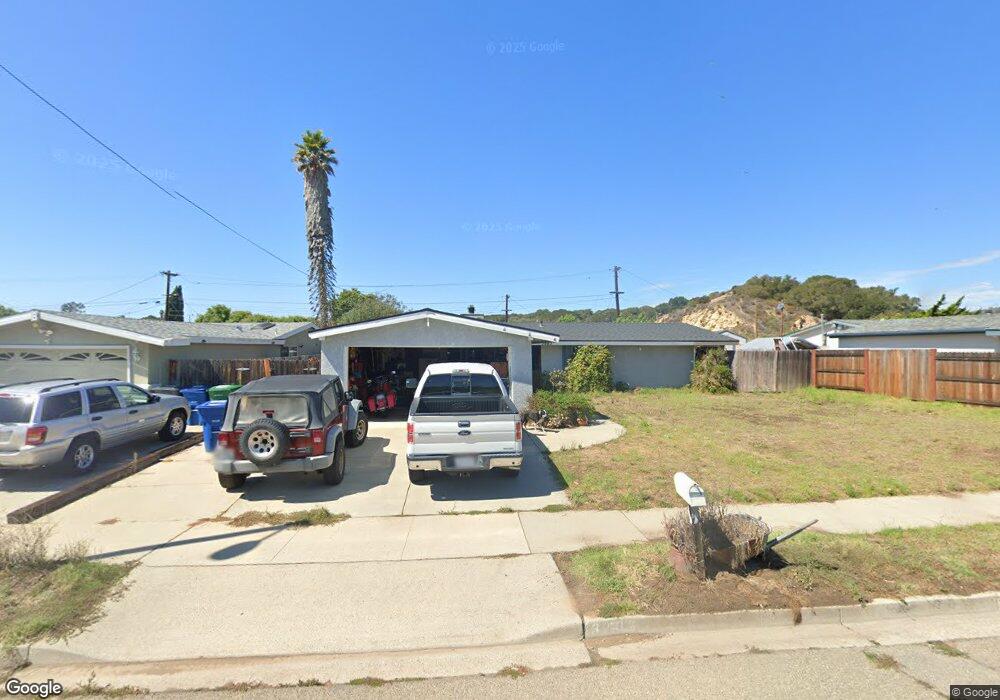
3883 Via Parte Lompoc, CA 93436
Mission Hills NeighborhoodEstimated Value: $516,000 - $581,000
4
Beds
2
Baths
1,522
Sq Ft
$364/Sq Ft
Est. Value
About This Home
This home is located at 3883 Via Parte, Lompoc, CA 93436 and is currently estimated at $553,710, approximately $363 per square foot. 3883 Via Parte is a home located in Santa Barbara County with nearby schools including Los Berros Visual and Performing Arts Academy, Cabrillo High School, and Olive Grove Charter - Lompoc.
Ownership History
Date
Name
Owned For
Owner Type
Purchase Details
Closed on
Oct 6, 2005
Sold by
Briseno Ramon and Briseno Maria Del Socorro
Bought by
Fox Robert R and Fox Cynthia A
Current Estimated Value
Purchase Details
Closed on
Apr 26, 1994
Sold by
Fox Robert R and Fox Cynthia A
Bought by
Fox Robert R and Fox Cynthia A
Home Financials for this Owner
Home Financials are based on the most recent Mortgage that was taken out on this home.
Original Mortgage
$96,000
Interest Rate
7.79%
Purchase Details
Closed on
Apr 4, 1994
Sold by
Va
Bought by
Fox Robert R and Fox Cynthia A
Home Financials for this Owner
Home Financials are based on the most recent Mortgage that was taken out on this home.
Original Mortgage
$96,000
Interest Rate
7.79%
Create a Home Valuation Report for This Property
The Home Valuation Report is an in-depth analysis detailing your home's value as well as a comparison with similar homes in the area
Home Values in the Area
Average Home Value in this Area
Purchase History
| Date | Buyer | Sale Price | Title Company |
|---|---|---|---|
| Fox Robert R | -- | Stewart Title | |
| Fox Robert R | -- | Trico Title | |
| Fox Robert R | -- | Trico Title |
Source: Public Records
Mortgage History
| Date | Status | Borrower | Loan Amount |
|---|---|---|---|
| Previous Owner | Fox Robert R | $96,000 |
Source: Public Records
Tax History
| Year | Tax Paid | Tax Assessment Tax Assessment Total Assessment is a certain percentage of the fair market value that is determined by local assessors to be the total taxable value of land and additions on the property. | Land | Improvement |
|---|---|---|---|---|
| 2025 | $1,311 | $128,017 | $31,060 | $96,957 |
| 2023 | $1,311 | $123,047 | $29,854 | $93,193 |
| 2022 | $1,286 | $120,635 | $29,269 | $91,366 |
| 2021 | $1,299 | $118,271 | $28,696 | $89,575 |
| 2020 | $1,284 | $117,059 | $28,402 | $88,657 |
| 2019 | $1,262 | $114,765 | $27,846 | $86,919 |
| 2018 | $1,241 | $112,515 | $27,300 | $85,215 |
| 2017 | $1,217 | $110,310 | $26,765 | $83,545 |
| 2016 | $1,193 | $108,148 | $26,241 | $81,907 |
| 2015 | $1,183 | $106,524 | $25,847 | $80,677 |
| 2014 | $1,165 | $104,438 | $25,341 | $79,097 |
Source: Public Records
Map
Nearby Homes
- 3838 Via Mitad
- 3770 Rucker Rd
- 3578 Via Lato
- 1588 Calle Portos
- 372 Falcon Crest Dr
- 384 Falcon Crest Dr
- 972 Pellham Dr
- 892 Onstott Rd
- 832 Onstott Rd
- 250 Saint Andrews Way
- 649 Burning Tree Way
- 757 Onstott Rd
- 4166 Oakwood Ct
- 4173 Oakwood Ct
- 778 Tamarisk Dr
- 4473 Greenbrier Rd
- 2655 Adobe Falls Rd
- 372 Oak Hill Dr
- 0 Oak Hill Dr Unit 24-783
- 3825 Saturn Ave Unit 1
- 3877 Via Parte
- 3891 Via Parte
- 3869 Via Parte
- 3894 Via Lato
- 1609 Calle Diez
- 3888 Via Parte
- 3882 Via Lato
- 3863 Via Parte
- 3894 Via Parte
- 3872 Via Parte
- 1589 Calle Lindero
- 1599 Calle Lindero
- 3876 Via Lato
- 3864 Via Parte
- 1607 Calle Lindero
- 3857 Via Parte
- 1620 Calle Lindero
- 1619 Calle Diez
- 1614 Calle Diez
Your Personal Tour Guide
Ask me questions while you tour the home.