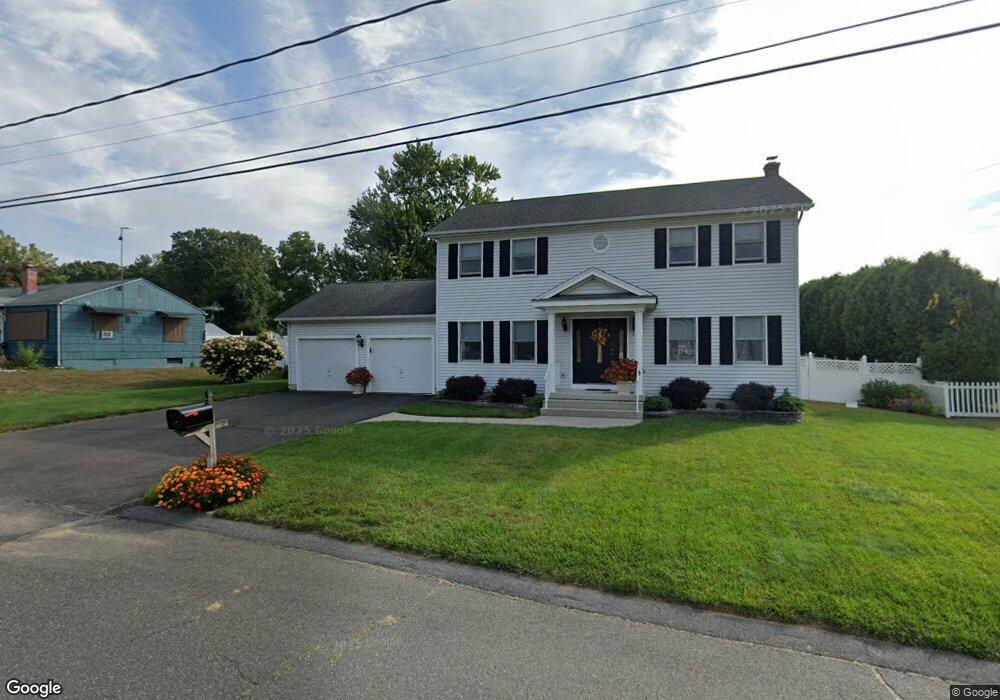
39 Access Rd Chicopee, MA 01020
Fairview NeighborhoodEstimated Value: $377,000 - $475,000
3
Beds
3
Baths
1,800
Sq Ft
$246/Sq Ft
Est. Value
About This Home
This home is located at 39 Access Rd, Chicopee, MA 01020 and is currently estimated at $441,994, approximately $245 per square foot. 39 Access Rd is a home located in Hampden County with nearby schools including Bowie Elementary School, Fairview Middle School, and Chicopee Comprehensive High School.
Ownership History
Date
Name
Owned For
Owner Type
Purchase Details
Closed on
Sep 30, 2003
Sold by
Waycon Inc
Bought by
Manning Brian L and Manning Katherine
Current Estimated Value
Home Financials for this Owner
Home Financials are based on the most recent Mortgage that was taken out on this home.
Original Mortgage
$189,125
Outstanding Balance
$88,741
Interest Rate
6.29%
Mortgage Type
Purchase Money Mortgage
Estimated Equity
$353,253
Create a Home Valuation Report for This Property
The Home Valuation Report is an in-depth analysis detailing your home's value as well as a comparison with similar homes in the area
Home Values in the Area
Average Home Value in this Area
Purchase History
| Date | Buyer | Sale Price | Title Company |
|---|---|---|---|
| Manning Brian L | $222,500 | -- |
Source: Public Records
Mortgage History
| Date | Status | Borrower | Loan Amount |
|---|---|---|---|
| Open | Manning Brian L | $189,125 |
Source: Public Records
Tax History
| Year | Tax Paid | Tax Assessment Tax Assessment Total Assessment is a certain percentage of the fair market value that is determined by local assessors to be the total taxable value of land and additions on the property. | Land | Improvement |
|---|---|---|---|---|
| 2025 | $6,305 | $415,900 | $111,000 | $304,900 |
| 2024 | $5,976 | $404,900 | $108,800 | $296,100 |
| 2023 | $5,584 | $368,600 | $98,900 | $269,700 |
| 2022 | $5,372 | $316,200 | $86,000 | $230,200 |
| 2021 | $5,123 | $290,900 | $78,200 | $212,700 |
| 2020 | $4,882 | $279,600 | $80,300 | $199,300 |
| 2019 | $4,783 | $266,300 | $80,300 | $186,000 |
| 2018 | $4,614 | $252,000 | $76,500 | $175,500 |
| 2017 | $3,916 | $226,200 | $70,200 | $156,000 |
| 2016 | $3,822 | $226,000 | $70,200 | $155,800 |
| 2015 | $4,015 | $228,900 | $70,200 | $158,700 |
| 2014 | $2,007 | $228,900 | $70,200 | $158,700 |
Source: Public Records
Map
Nearby Homes
- 81 Mccarthy Ave
- 523 James St
- 1709 Memorial Dr
- 104 Johnson Rd Unit 1103
- 104 Johnson Rd Unit 707
- 240 Mccarthy Ave
- 61 Saint Jacques Ave
- 144 Horseshoe Dr
- 156 Horseshoe Dr
- 67 Streiber Dr
- 58 Robinridge Rd
- 20 Richmond Way
- 143 Royal St
- 83 Old Farm Rd
- 37 Greenwood Terrace
- 460 Irene St
- 84 Montcalm St
- 70 Greenwood Terrace
- 15 Hudson Ave
- 90 Anson St
Your Personal Tour Guide
Ask me questions while you tour the home.