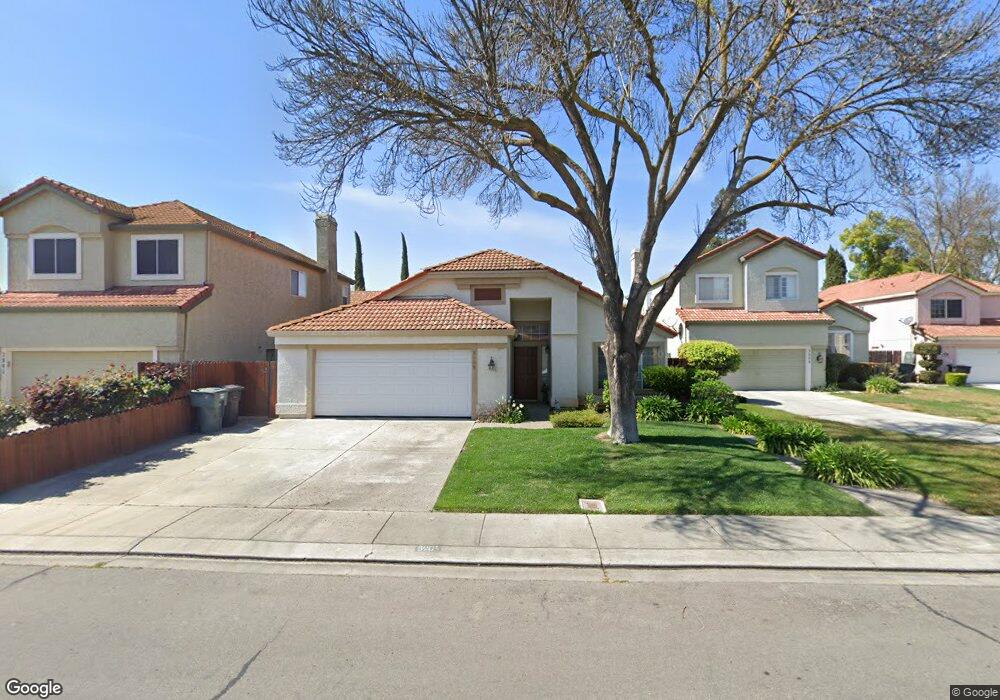
3905 Terhune Ct Modesto, CA 95356
Estimated Value: $447,000 - $488,000
3
Beds
2
Baths
1,687
Sq Ft
$275/Sq Ft
Est. Value
About This Home
This home is located at 3905 Terhune Ct, Modesto, CA 95356 and is currently estimated at $463,123, approximately $274 per square foot. 3905 Terhune Ct is a home located in Stanislaus County with nearby schools including Agnes M. Baptist Elementary School, Prescott Junior High School, and Grace M. Davis High School.
Ownership History
Date
Name
Owned For
Owner Type
Purchase Details
Closed on
Oct 19, 2016
Sold by
Peres Maria Z
Bought by
Peres Maria Z and Manuel & Maria Peres Family Tr
Current Estimated Value
Purchase Details
Closed on
Jul 11, 2011
Sold by
Peres Maria Z and Cannistraci Sam E
Bought by
Peres Maria Z
Home Financials for this Owner
Home Financials are based on the most recent Mortgage that was taken out on this home.
Original Mortgage
$124,800
Outstanding Balance
$9,324
Interest Rate
4.45%
Mortgage Type
New Conventional
Estimated Equity
$453,799
Purchase Details
Closed on
Apr 5, 2010
Sold by
Hernandez David and Hernandez Lorie
Bought by
Peres Maria Z and Cannistraci Sam E
Home Financials for this Owner
Home Financials are based on the most recent Mortgage that was taken out on this home.
Original Mortgage
$128,000
Interest Rate
4.95%
Mortgage Type
New Conventional
Create a Home Valuation Report for This Property
The Home Valuation Report is an in-depth analysis detailing your home's value as well as a comparison with similar homes in the area
Purchase History
| Date | Buyer | Sale Price | Title Company |
|---|---|---|---|
| Peres Maria Z | -- | None Available | |
| Peres Maria Z | -- | First American Title Ins Co | |
| Peres Maria Z | $160,000 | North American Title Company |
Source: Public Records
Mortgage History
| Date | Status | Borrower | Loan Amount |
|---|---|---|---|
| Open | Peres Maria Z | $124,800 | |
| Closed | Peres Maria Z | $128,000 |
Source: Public Records
Tax History
| Year | Tax Paid | Tax Assessment Tax Assessment Total Assessment is a certain percentage of the fair market value that is determined by local assessors to be the total taxable value of land and additions on the property. | Land | Improvement |
|---|---|---|---|---|
| 2025 | $2,300 | $206,519 | $51,627 | $154,892 |
| 2024 | $2,217 | $202,470 | $50,615 | $151,855 |
| 2023 | $2,175 | $198,501 | $49,623 | $148,878 |
| 2022 | $2,114 | $194,609 | $48,650 | $145,959 |
| 2021 | $1,997 | $190,795 | $47,697 | $143,098 |
| 2020 | $1,970 | $188,839 | $47,208 | $141,631 |
| 2019 | $1,945 | $185,137 | $46,283 | $138,854 |
| 2018 | $1,920 | $181,508 | $45,376 | $136,132 |
| 2017 | $1,874 | $177,950 | $44,487 | $133,463 |
| 2016 | $1,823 | $174,462 | $43,615 | $130,847 |
| 2015 | $1,807 | $171,842 | $42,960 | $128,882 |
| 2014 | $1,786 | $168,477 | $42,119 | $126,358 |
Source: Public Records
Map
Nearby Homes
- 1805 Patton Dr
- 1813 Mark Mead Ln
- 1725 Mark Mead Ln
- 1912 Middelburg Ct
- 1917 Middelburg Ct
- 1637 Carlisle Ave
- 3601 Agate Dr
- 3809 Longbridge Dr
- 4208 Keepsake Ct
- 1604 Rose Garden Ct
- 4020 Moss Rock Ct
- 3713 Felkirk Way
- 2117 Manitoba Ct
- 2108 Canadian Cir
- 1500 Kirkland Ct
- 3668 Veneman Ave N
- 4305 Remey Ct
- 4112 Hidden Meadow Ct
- 3808 Thornbury Way
- 1459 Standiford Ave Unit 68
- 3901 Terhune Ct
- 3909 Terhune Ct
- 1801 Volendam Ave
- 3913 Terhune Ct
- 1805 Volendam Ave
- 3904 Terhune Ct
- 3917 Terhune Ct
- 3908 Terhune Ct
- 3900 Terhune Ct
- 3908 Breda Ct
- 3912 Terhune Ct
- 3912 Breda Ct
- 1740 Volendam Ave
- 1736 Volendam Ave
- 1800 Volendam Ave
- 3904 Breda Ct
- 3916 Terhune Ct
- 1732 Volendam Ave
- 3900 Breda Ct
- 1804 Volendam Ave
Your Personal Tour Guide
Ask me questions while you tour the home.