
Seller's Agent in 2020
Debbie Pontikas
RETSY
(480) 335-8604
46 in this area
133 Total Sales

Estimated Value: $1,006,000 - $1,516,000
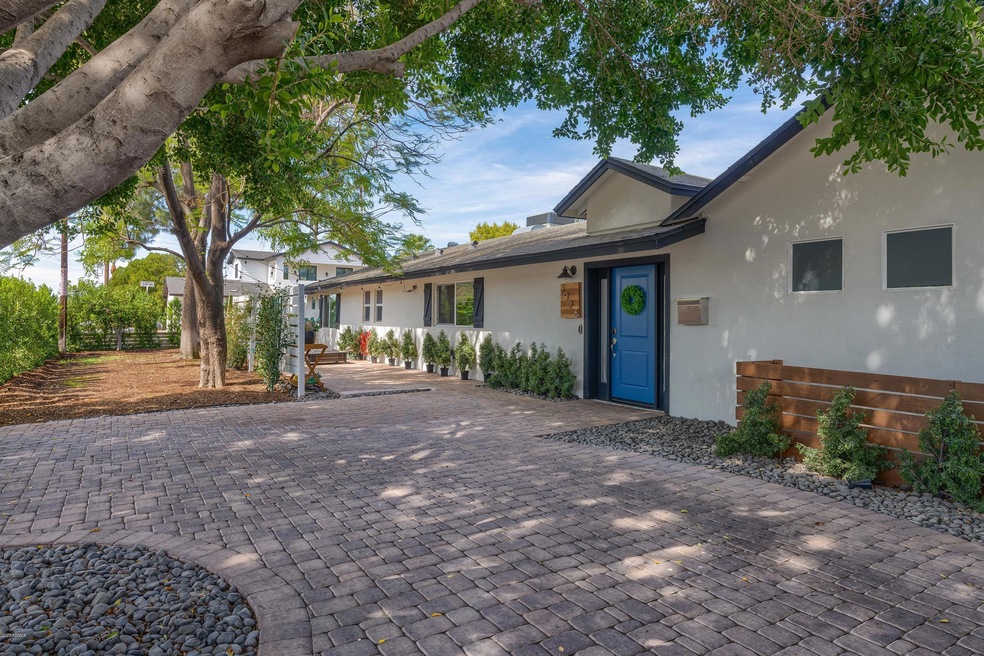
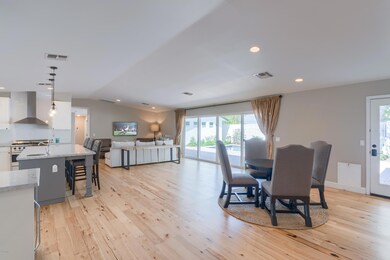
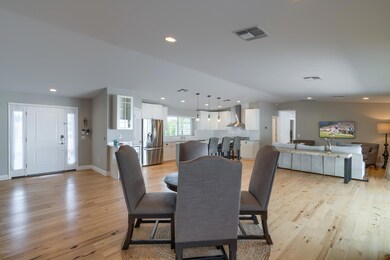
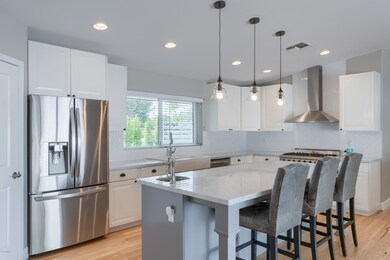
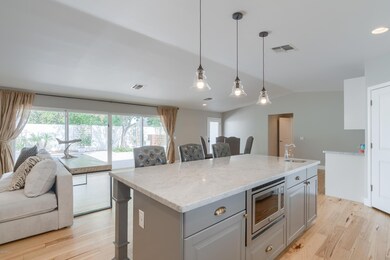
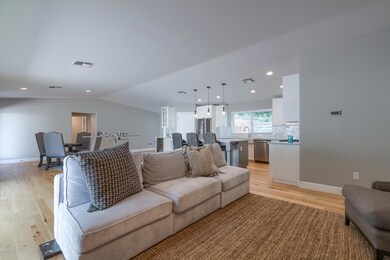
Location, Location, Location!! You can't beat the location of this beautiful Blue Sky remodel. Across the street from LGO, Postinos and Ingos. This 4B/3B Arcadia charmer wont last long. Beautiful Ficus trees line the fence enclosing your private patio. Inside you will find a split floorplan, with an open and bright living room. Relax out back by the pool or enjoy a relaxing evening in the spa. Keep this one on your list and make sure you schedule a showing when this one hits the market!
| Date | Buyer | Sale Price | Title Company |
|---|---|---|---|
| Six Twenty Six Llc | -- | Valleywide Title Agency Llc | |
| Anderson Cory | $890,000 | Valleywide Title Agency | |
| Twenty Six Llc | $790,000 | Premier Title Agency | |
| Ginder Chelsey | $650,000 | Clear Title Agency Of Az | |
| True Freedom Achievers Llc | -- | Accommodation | |
| True Freedom Achievers Llc | $300,000 | First American Title Ins Co | |
| Trusiak Mark | -- | -- | |
| Trusiak Mark A | -- | -- |
| Date | Status | Borrower | Loan Amount |
|---|---|---|---|
| Open | Anderson Cory | $712,000 | |
| Previous Owner | Ginder Chelsey | $584,935 | |
| Previous Owner | True Freedom Achievers Llc | $300,000 |
| Date | Event | Price | List to Sale | Price per Sq Ft | Prior Sale |
|---|---|---|---|---|---|
| 12/29/2020 12/29/20 | Sold | $890,000 | -0.6% | $356 / Sq Ft | |
| 11/24/2020 11/24/20 | Pending | -- | -- | -- | |
| 11/17/2020 11/17/20 | Price Changed | $895,000 | -3.2% | $358 / Sq Ft | |
| 11/05/2020 11/05/20 | Price Changed | $925,000 | -2.5% | $370 / Sq Ft | |
| 09/13/2020 09/13/20 | For Sale | $949,000 | +20.1% | $380 / Sq Ft | |
| 07/02/2018 07/02/18 | Sold | $790,000 | -1.3% | $316 / Sq Ft | View Prior Sale |
| 04/24/2018 04/24/18 | For Sale | $800,000 | +23.1% | $320 / Sq Ft | |
| 08/03/2015 08/03/15 | Sold | $650,000 | -3.7% | $260 / Sq Ft | View Prior Sale |
| 06/16/2015 06/16/15 | Pending | -- | -- | -- | |
| 06/10/2015 06/10/15 | Price Changed | $675,000 | -2.0% | $270 / Sq Ft | |
| 05/29/2015 05/29/15 | For Sale | $689,000 | +6.0% | $276 / Sq Ft | |
| 05/28/2015 05/28/15 | Off Market | $650,000 | -- | -- | |
| 05/27/2015 05/27/15 | Price Changed | $689,000 | -0.1% | $276 / Sq Ft | |
| 05/22/2015 05/22/15 | Price Changed | $689,500 | -0.1% | $276 / Sq Ft | |
| 05/12/2015 05/12/15 | Price Changed | $689,900 | -0.6% | $276 / Sq Ft | |
| 05/06/2015 05/06/15 | Price Changed | $694,000 | -0.1% | $278 / Sq Ft | |
| 05/01/2015 05/01/15 | Price Changed | $694,900 | 0.0% | $278 / Sq Ft | |
| 04/24/2015 04/24/15 | Price Changed | $695,000 | -0.3% | $278 / Sq Ft | |
| 04/13/2015 04/13/15 | Price Changed | $697,400 | 0.0% | $279 / Sq Ft | |
| 04/08/2015 04/08/15 | Price Changed | $697,500 | -0.3% | $279 / Sq Ft | |
| 03/30/2015 03/30/15 | Price Changed | $699,500 | -0.1% | $280 / Sq Ft | |
| 03/13/2015 03/13/15 | For Sale | $699,900 | +133.3% | $280 / Sq Ft | |
| 03/24/2014 03/24/14 | Sold | $300,000 | -15.3% | $135 / Sq Ft | View Prior Sale |
| 01/28/2014 01/28/14 | Pending | -- | -- | -- | |
| 01/18/2014 01/18/14 | Price Changed | $354,000 | -14.7% | $159 / Sq Ft | |
| 01/02/2014 01/02/14 | Price Changed | $415,000 | -17.0% | $186 / Sq Ft | |
| 12/08/2013 12/08/13 | For Sale | $499,900 | -- | $224 / Sq Ft |
| Year | Tax Paid | Tax Assessment Tax Assessment Total Assessment is a certain percentage of the fair market value that is determined by local assessors to be the total taxable value of land and additions on the property. | Land | Improvement |
|---|---|---|---|---|
| 2025 | $6,100 | $54,895 | -- | -- |
| 2024 | $6,454 | $52,281 | -- | -- |
| 2023 | $6,454 | $86,230 | $17,240 | $68,990 |
| 2022 | $6,177 | $65,560 | $13,110 | $52,450 |
| 2021 | $6,343 | $62,250 | $12,450 | $49,800 |
| 2020 | $6,173 | $57,650 | $11,530 | $46,120 |
| 2019 | $6,126 | $51,410 | $10,280 | $41,130 |
| 2018 | $6,588 | $49,370 | $9,870 | $39,500 |
| 2017 | $5,733 | $48,950 | $9,790 | $39,160 |
| 2016 | $5,488 | $46,560 | $9,310 | $37,250 |
| 2015 | $4,264 | $32,970 | $6,590 | $26,380 |
Seller's Agent in 2020
Debbie Pontikas
RETSY
(480) 335-8604
46 in this area
133 Total Sales
Buyer's Agent in 2020
Trevor Hendrickson
West USA Realty
(480) 532-6271
73 Total Sales
C
Seller's Agent in 2018
Christopher Karas
Compass
Seller Co-Listing Agent in 2018
Marissa Kline
Compass
(602) 821-4479
25 in this area
62 Total Sales
B
Buyer's Agent in 2018
Bonnie Baker
Local Luxury Christie's International Real Estate
N
Seller's Agent in 2015
Nick Blue
Urban Blue Realty, LLC
Source: Arizona Regional Multiple Listing Service (ARMLS)
MLS Number: 6131606
APN: 170-24-102
Disclaimer: Certain information contained herein is derived from information provided by parties other than Homes.com. All information provided is deemed reliable, but is not guaranteed to be accurate and should be independently verified.
![]() All information should be verified by the recipient and none is guaranteed as accurate by ARMLS
All information should be verified by the recipient and none is guaranteed as accurate by ARMLS
Listing Information presented by local MLS brokerage: Ten-X, local REALTOR®- Arlene Richardson - (888)-952-6393
Ask me questions while you tour the home.