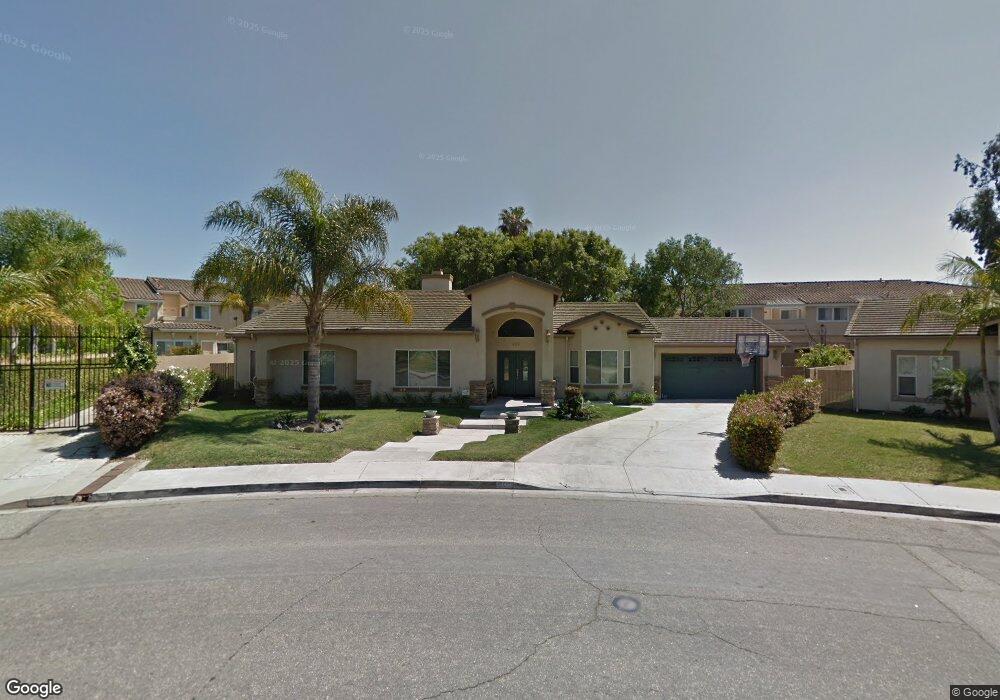
400 Delphinium Place Oxnard, CA 93036
Orchard NeighborhoodEstimated Value: $884,000 - $1,112,000
3
Beds
3
Baths
2,432
Sq Ft
$403/Sq Ft
Est. Value
About This Home
This home is located at 400 Delphinium Place, Oxnard, CA 93036 and is currently estimated at $981,065, approximately $403 per square foot. 400 Delphinium Place is a home located in Ventura County with nearby schools including Rio Del Norte Elementary School, Rio Vista Middle School, and Rio Mesa High School.
Ownership History
Date
Name
Owned For
Owner Type
Purchase Details
Closed on
Aug 16, 2003
Sold by
Parga Delia Cortez
Bought by
Parga James Rios
Current Estimated Value
Purchase Details
Closed on
Mar 18, 2003
Sold by
Parga James Rios
Bought by
Melgoza Gustavo and Melgoza Alicia
Home Financials for this Owner
Home Financials are based on the most recent Mortgage that was taken out on this home.
Original Mortgage
$290,000
Interest Rate
5.46%
Mortgage Type
Purchase Money Mortgage
Purchase Details
Closed on
Aug 27, 1998
Sold by
Isaac Marcello
Bought by
Parga James Rios
Home Financials for this Owner
Home Financials are based on the most recent Mortgage that was taken out on this home.
Original Mortgage
$25,000
Interest Rate
6.92%
Purchase Details
Closed on
May 19, 1994
Sold by
Mid Coast Builders Inc
Bought by
Make A Wish Foundation Of The Tri Counti
Create a Home Valuation Report for This Property
The Home Valuation Report is an in-depth analysis detailing your home's value as well as a comparison with similar homes in the area
Home Values in the Area
Average Home Value in this Area
Purchase History
| Date | Buyer | Sale Price | Title Company |
|---|---|---|---|
| Parga James Rios | -- | Chicago Title Co | |
| Melgoza Gustavo | $322,500 | Chicago Title Co | |
| Parga James Rios | $35,000 | American Title Co | |
| Make A Wish Foundation Of The Tri Counti | -- | -- |
Source: Public Records
Mortgage History
| Date | Status | Borrower | Loan Amount |
|---|---|---|---|
| Previous Owner | Melgoza Gustavo | $290,000 | |
| Previous Owner | Parga James Rios | $25,000 |
Source: Public Records
Tax History Compared to Growth
Tax History
| Year | Tax Paid | Tax Assessment Tax Assessment Total Assessment is a certain percentage of the fair market value that is determined by local assessors to be the total taxable value of land and additions on the property. | Land | Improvement |
|---|---|---|---|---|
| 2025 | $7,422 | $639,784 | $319,893 | $319,891 |
| 2024 | $7,422 | $627,240 | $313,621 | $313,619 |
| 2023 | $7,221 | $614,942 | $307,472 | $307,470 |
| 2022 | $7,014 | $602,885 | $301,443 | $301,442 |
| 2021 | $7,032 | $591,064 | $295,532 | $295,532 |
| 2020 | $7,183 | $585,004 | $292,502 | $292,502 |
| 2019 | $6,888 | $573,534 | $286,767 | $286,767 |
| 2018 | $6,653 | $562,290 | $281,145 | $281,145 |
| 2017 | $6,474 | $551,266 | $275,633 | $275,633 |
| 2016 | $6,196 | $540,458 | $270,229 | $270,229 |
| 2015 | $6,295 | $532,342 | $266,171 | $266,171 |
| 2014 | -- | $521,916 | $260,958 | $260,958 |
Source: Public Records
Map
Nearby Homes
- 2077 Blackberry Cir
- 2027 Blackberry Cir
- 2085 Koala Place
- 408 Grande St
- 560 W Gonzales Rd
- 620 W Gonzales Rd
- 620 W Gonzales Rd Unit B
- 620 W Gonzales Rd Unit C
- 620 W Gonzales Rd Unit D
- 620 W Gonzales Rd Unit A
- 2020 Ironbark Dr
- 550 Lawnwood Way
- 1920 N H St Unit 235
- 1920 N H St Unit 251
- 637 Holly Ave
- 643 Holly Ave
- 300 Plum Place Unit 7
- 723 Ivywood Dr
- 2455 Blueberry Dr Unit 120
- 521 Glenwood Dr
- 410 Delphinium Place
- 2121 Blackberry Cir
- 2119 Blackberry Cir Unit 2119
- 2117 Blackberry Cir
- 2115 Blackberry Cir
- 2113 Blackberry Cir
- 2111 Blackberry Cir
- 2144 Blackberry Cir
- 2132 Blackberry Cir
- 2136 Blackberry Cir
- 2140 Blackberry Cir
- 2142 Blackberry Cir
- 2138 Blackberry Cir
- 2134 Blackberry Cir
- 2130 Blackberry Cir
- 2146 Blackberry Cir
- 2109 Blackberry Cir
- 2107 Blackberry Cir
- 2103 Blackberry Cir
- 2105 Blackberry Cir