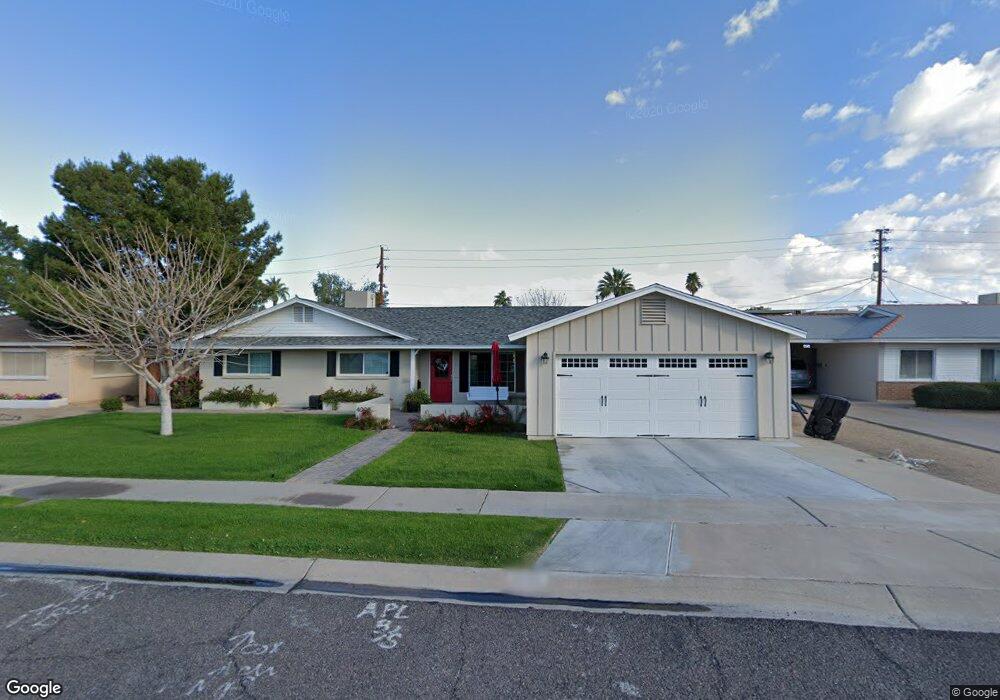
4008 E Turney Ave Phoenix, AZ 85018
Camelback East Village NeighborhoodEstimated Value: $821,000 - $1,301,718
3
Beds
2
Baths
1,318
Sq Ft
$760/Sq Ft
Est. Value
About This Home
This home is located at 4008 E Turney Ave, Phoenix, AZ 85018 and is currently estimated at $1,001,180, approximately $759 per square foot. 4008 E Turney Ave is a home located in Maricopa County with nearby schools including Hopi Elementary School, Ingleside Middle School, and Arcadia High School.
Ownership History
Date
Name
Owned For
Owner Type
Purchase Details
Closed on
Feb 23, 2018
Sold by
Vance Annabelle and Vance Xue T
Bought by
Vance Annabelle and The Annabelle Vance Trust
Current Estimated Value
Purchase Details
Closed on
Apr 29, 2008
Sold by
Jaynes Alfonso Larry
Bought by
Vance Brian M and Vance Xue Tian
Home Financials for this Owner
Home Financials are based on the most recent Mortgage that was taken out on this home.
Original Mortgage
$225,000
Outstanding Balance
$142,491
Interest Rate
5.88%
Mortgage Type
Purchase Money Mortgage
Estimated Equity
$858,689
Purchase Details
Closed on
Jan 16, 2008
Sold by
Estate Of Harold Eugene Tucker and Jaynes Alfonso Larry
Bought by
Jaynes Alfonso Larry
Purchase Details
Closed on
Nov 10, 2003
Sold by
Whittenberg Robert
Bought by
Whittenberg Gail E
Purchase Details
Closed on
Jan 18, 1995
Sold by
Hanes Linda
Bought by
Hanes Sylvester L
Create a Home Valuation Report for This Property
The Home Valuation Report is an in-depth analysis detailing your home's value as well as a comparison with similar homes in the area
Home Values in the Area
Average Home Value in this Area
Purchase History
| Date | Buyer | Sale Price | Title Company |
|---|---|---|---|
| Vance Annabelle | -- | None Available | |
| Vance Brian M | $250,000 | Equity Title Agency Inc | |
| Jaynes Alfonso Larry | -- | None Available | |
| Jaynes Alfonso Larry | -- | None Available | |
| Whittenberg Gail E | -- | Capital Title Agency Inc | |
| Hanes Sylvester L | -- | Security Title Agency |
Source: Public Records
Mortgage History
| Date | Status | Borrower | Loan Amount |
|---|---|---|---|
| Open | Vance Brian M | $225,000 |
Source: Public Records
Tax History
| Year | Tax Paid | Tax Assessment Tax Assessment Total Assessment is a certain percentage of the fair market value that is determined by local assessors to be the total taxable value of land and additions on the property. | Land | Improvement |
|---|---|---|---|---|
| 2025 | $2,915 | $40,986 | -- | -- |
| 2024 | $2,703 | $39,034 | -- | -- |
| 2023 | $2,703 | $81,820 | $16,360 | $65,460 |
| 2022 | $2,604 | $57,800 | $11,560 | $46,240 |
| 2021 | $2,736 | $50,630 | $10,120 | $40,510 |
| 2020 | $2,693 | $45,230 | $9,040 | $36,190 |
| 2019 | $1,788 | $29,370 | $5,870 | $23,500 |
| 2018 | $1,732 | $27,350 | $5,470 | $21,880 |
| 2017 | $1,643 | $25,360 | $5,070 | $20,290 |
| 2016 | $1,598 | $23,900 | $4,780 | $19,120 |
| 2015 | $1,469 | $22,600 | $4,520 | $18,080 |
Source: Public Records
Map
Nearby Homes
- 4411 N 40th St Unit 51
- 4015 E Glenrosa Ave
- 4113 E Glenrosa Ave
- 4136 E Montecito Ave
- 4126 E Sells Dr Unit 106
- 4126 E Sells Dr
- 4037 E Minnezona Ave
- 4223 N 41st Place
- 4202 N 41st Place
- 4525 N 40th St
- 4525 N 40th St Unit 7
- 3838 E Devonshire Ave
- 4021 E Hazelwood St
- 3830 E Devonshire Ave
- 4234 N 42nd Place
- 3821 E Devonshire Ave
- 4227 E Campbell Ave
- 3738 E Montecito Ave
- 3736 E Montecito Ave
- 4620 N 40th St
- 4014 E Turney Ave
- 4002 E Turney Ave
- 4020 E Turney Ave
- 4401 N 40th #38 St Unit 38
- 4007 E Turney Ave
- 4001 E Turney Ave
- 4013 E Turney Ave
- 4026 E Turney Ave
- 4019 E Turney Ave
- 4401 N 40th St Unit 7
- 4401 N 40th St Unit 50
- 4401 N 40th St Unit 39
- 4401 N 40th St Unit 53
- 4401 N 40th St
- 4401 N 40th St Unit 23
- 4401 N 40th St Unit 1
- 4401 N 40th St Unit 15
- 4401 N 40th St Unit 6
- 4401 N 40th St Unit 2
- 4401 N 40th St Unit 17
Your Personal Tour Guide
Ask me questions while you tour the home.