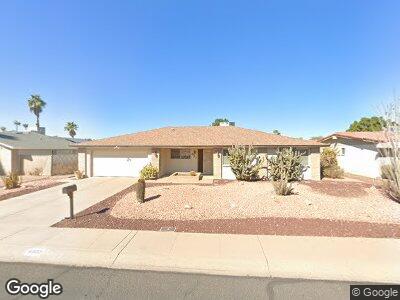
4010 W Dailey St Phoenix, AZ 85053
Deer Valley NeighborhoodEstimated Value: $342,642 - $452,000
--
Bed
2
Baths
1,893
Sq Ft
$220/Sq Ft
Est. Value
About This Home
This home is located at 4010 W Dailey St, Phoenix, AZ 85053 and is currently estimated at $415,661, approximately $219 per square foot. 4010 W Dailey St is a home located in Maricopa County with nearby schools including Ironwood Elementary School, Desert Foothills Middle School, and Greenway High School.
Ownership History
Date
Name
Owned For
Owner Type
Purchase Details
Closed on
Oct 10, 2003
Sold by
Montemagno Gary and Montemagno Teresa
Bought by
Montemagno Teresa
Current Estimated Value
Home Financials for this Owner
Home Financials are based on the most recent Mortgage that was taken out on this home.
Original Mortgage
$133,726
Interest Rate
6.4%
Mortgage Type
FHA
Purchase Details
Closed on
Mar 7, 2002
Sold by
Mcnabb Donald C
Bought by
Mcnabb Bunty M
Purchase Details
Closed on
Oct 23, 1997
Sold by
Delpozzo Anthony A and Delpozzo Lisa M
Bought by
Montemagno Gary and Montemagno Teresa
Home Financials for this Owner
Home Financials are based on the most recent Mortgage that was taken out on this home.
Original Mortgage
$108,947
Interest Rate
7.19%
Mortgage Type
FHA
Create a Home Valuation Report for This Property
The Home Valuation Report is an in-depth analysis detailing your home's value as well as a comparison with similar homes in the area
Home Values in the Area
Average Home Value in this Area
Purchase History
| Date | Buyer | Sale Price | Title Company |
|---|---|---|---|
| Montemagno Teresa | -- | Stewart Title & Trust | |
| Mcnabb Bunty M | -- | Fidelity National Title | |
| Mcnabb Bunty M | -- | Fidelity National Title | |
| Mcnabb Michael L | -- | Fidelity National Title | |
| Montemagno Gary | $110,000 | Lawyers Title Of Arizona Inc |
Source: Public Records
Mortgage History
| Date | Status | Borrower | Loan Amount |
|---|---|---|---|
| Open | Montemagno Teresa Luise | $75,000 | |
| Open | Montemagno Teresa | $206,349 | |
| Closed | Montemagno Teresa | $193,000 | |
| Closed | Montemagno Teresa | $144,000 | |
| Closed | Montemagno Teresa | $133,726 | |
| Previous Owner | Montemagno Gary | $108,947 |
Source: Public Records
Tax History Compared to Growth
Tax History
| Year | Tax Paid | Tax Assessment Tax Assessment Total Assessment is a certain percentage of the fair market value that is determined by local assessors to be the total taxable value of land and additions on the property. | Land | Improvement |
|---|---|---|---|---|
| 2025 | $1,615 | $15,070 | -- | -- |
| 2024 | $1,583 | $14,352 | -- | -- |
| 2023 | $1,583 | $31,400 | $6,280 | $25,120 |
| 2022 | $1,528 | $24,180 | $4,830 | $19,350 |
| 2021 | $1,566 | $22,180 | $4,430 | $17,750 |
| 2020 | $1,524 | $20,680 | $4,130 | $16,550 |
| 2019 | $1,496 | $19,520 | $3,900 | $15,620 |
| 2018 | $1,454 | $17,960 | $3,590 | $14,370 |
| 2017 | $1,450 | $15,650 | $3,130 | $12,520 |
| 2016 | $1,424 | $15,120 | $3,020 | $12,100 |
| 2015 | $1,321 | $14,500 | $2,900 | $11,600 |
Source: Public Records
Map
Nearby Homes
- 14017 N 40th Ave
- 3973 W Hearn Rd
- 13834 N 39th Ln
- 4136 W Hearn Rd
- 4219 W Dailey St
- 3837 W Dailey St
- 3828 W Crocus Dr
- 3953 W Evans Dr
- 4007 W Rue de Lamour Ave
- 3754 W Hearn Rd
- 3743 W Dailey St
- 4308 W Redfield Rd
- 3802 W Rue de Lamour Ave
- 3719 W Thunderbird Rd
- 13801 N 37th Dr
- 4023 W Joan de Arc Ave
- 14801 N 39th Ave
- 3636 W Crocus Dr
- 14209 N 45th Ave
- 3774 W Wood Dr Unit 5
- 4010 W Dailey St
- 4016 W Dailey St
- 4002 W Dailey St
- 4009 W Redfield Rd
- 4015 W Redfield Rd
- 4001 W Redfield Rd
- 4022 W Dailey St
- 4009 W Dailey St
- 4101 W Redfield Rd
- 4001 W Dailey St
- 4017 W Dailey St
- 14011 N 40th Ave
- 4028 W Dailey St
- 4111 W Redfield Rd
- 4023 W Dailey St
- 14001 N 40th Ave
- 14023 N 40th Ave
- 13854 N 40th Ave
- 4010 W Redfield Rd
- 4002 W Redfield Rd