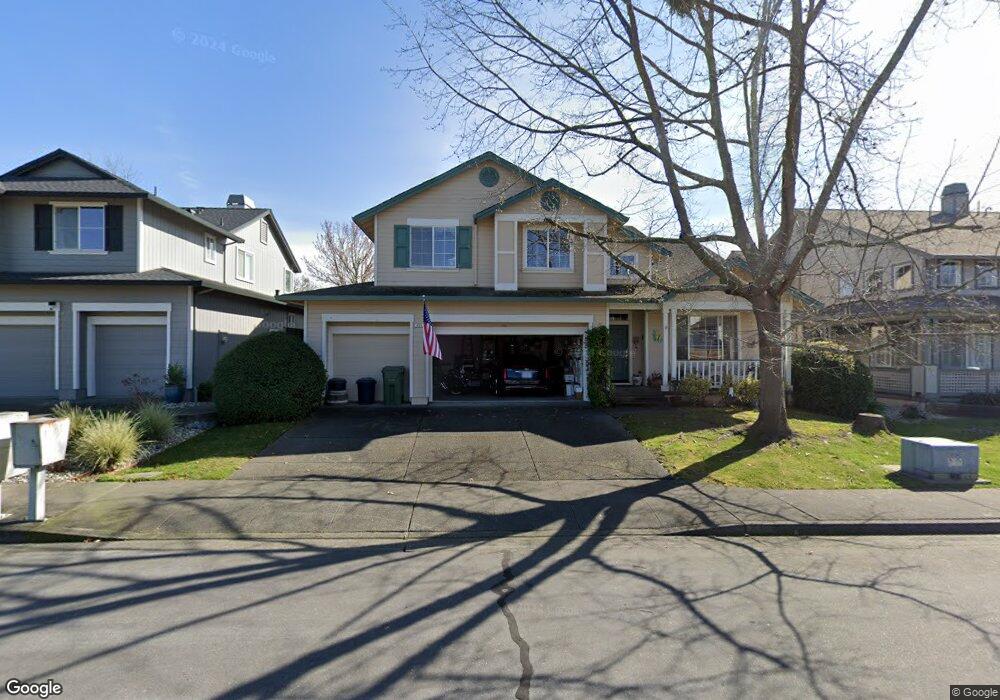
425 Christopher Way Windsor, CA 95492
Estimated Value: $881,000 - $976,000
5
Beds
3
Baths
2,595
Sq Ft
$361/Sq Ft
Est. Value
About This Home
This home is located at 425 Christopher Way, Windsor, CA 95492 and is currently estimated at $937,997, approximately $361 per square foot. 425 Christopher Way is a home located in Sonoma County with nearby schools including Brooks Elementary School, Mattie Washburn Elementary School, and Windsor Middle School.
Ownership History
Date
Name
Owned For
Owner Type
Purchase Details
Closed on
May 12, 2003
Sold by
Weagle William C and Weagle Elizabeth L
Bought by
Weagle William C and Weagle Elizabeth L
Current Estimated Value
Purchase Details
Closed on
Sep 10, 1998
Sold by
Frandsen Jeffrey J and Frandsen Lori A
Bought by
Milazzo Pilar P
Home Financials for this Owner
Home Financials are based on the most recent Mortgage that was taken out on this home.
Original Mortgage
$248,000
Outstanding Balance
$39,891
Interest Rate
3.95%
Estimated Equity
$898,106
Purchase Details
Closed on
Dec 16, 1994
Sold by
Arata Estates Investors
Bought by
Frandsen Jeffrey J and Frandsen Lori A
Home Financials for this Owner
Home Financials are based on the most recent Mortgage that was taken out on this home.
Original Mortgage
$227,250
Interest Rate
5.12%
Create a Home Valuation Report for This Property
The Home Valuation Report is an in-depth analysis detailing your home's value as well as a comparison with similar homes in the area
Home Values in the Area
Average Home Value in this Area
Purchase History
| Date | Buyer | Sale Price | Title Company |
|---|---|---|---|
| Weagle William C | -- | -- | |
| Milazzo Pilar P | $310,000 | Old Republic Title | |
| Frandsen Jeffrey J | $252,500 | North Bay Title Co |
Source: Public Records
Mortgage History
| Date | Status | Borrower | Loan Amount |
|---|---|---|---|
| Open | Milazzo Pilar P | $248,000 | |
| Previous Owner | Frandsen Jeffrey J | $227,250 |
Source: Public Records
Tax History
| Year | Tax Paid | Tax Assessment Tax Assessment Total Assessment is a certain percentage of the fair market value that is determined by local assessors to be the total taxable value of land and additions on the property. | Land | Improvement |
|---|---|---|---|---|
| 2025 | $5,920 | $485,982 | $125,409 | $360,573 |
| 2024 | $5,920 | $476,453 | $122,950 | $353,503 |
| 2023 | $5,920 | $467,112 | $120,540 | $346,572 |
| 2022 | $5,706 | $457,954 | $118,177 | $339,777 |
| 2021 | $5,615 | $448,975 | $115,860 | $333,115 |
| 2020 | $5,736 | $444,372 | $114,672 | $329,700 |
| 2019 | $5,728 | $435,660 | $112,424 | $323,236 |
| 2018 | $5,646 | $427,119 | $110,220 | $316,899 |
| 2017 | $5,595 | $418,745 | $108,059 | $310,686 |
| 2016 | $5,249 | $410,536 | $105,941 | $304,595 |
| 2015 | $5,107 | $404,370 | $104,350 | $300,020 |
| 2014 | $5,030 | $396,450 | $102,306 | $294,144 |
Source: Public Records
Map
Nearby Homes
- 207 Othello Ct
- 129 Wooded Glen Ct
- 9453 Jessica Dr
- 10845 Rio Ruso Dr
- 100 Wooded Glen Ct
- 9821 Dawn Way
- 411 Walten Way
- 105 Zapata Ct
- 849 Patti Page Ct
- 985 Gumview Rd
- 933 Bond Place
- 9551 Old Redwood Hwy
- 8185 Old Redwood Hwy
- 9131 Benny Goodman Way
- 772 Mcclelland Dr Unit U11
- 191 Johnson St
- 185 Johnson St
- 125 Johnson St
- 202 Johnson St Unit U14
- 913 Turnberry Ct
- 431 Christopher Way
- 419 Christopher Way
- 391 Pollard Way
- 389 Pollard Way
- 393 Pollard Way
- 413 Christopher Way
- 437 Christopher Way
- 385 Pollard Way
- 397 Pollard Way
- 428 Christopher Way
- 9543 Ashley Dr
- 383 Pollard Way
- 399 Pollard Way
- 9522 Camelot Dr
- 407 Christopher Way
- 381 Pollard Way
- 9545 Ashley Dr
- 9524 Camelot Dr
- 316 Dominic Ct
- 501 Christopher Way
Your Personal Tour Guide
Ask me questions while you tour the home.