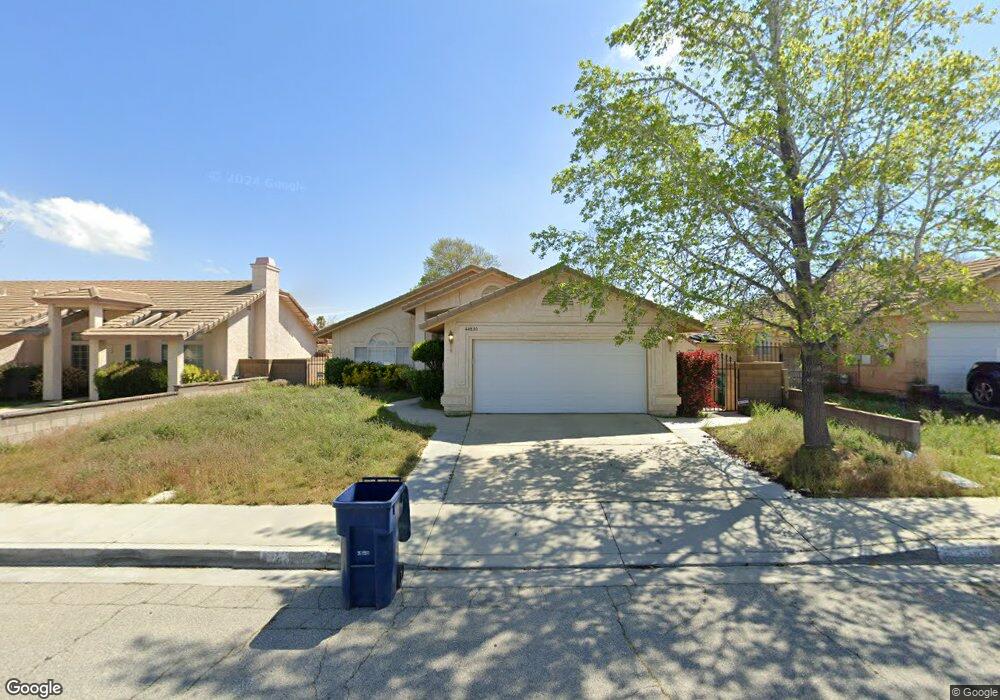
44830 13th St E Lancaster, CA 93535
East Lancaster NeighborhoodEstimated Value: $381,000 - $448,000
3
Beds
2
Baths
1,573
Sq Ft
$265/Sq Ft
Est. Value
About This Home
This home is located at 44830 13th St E, Lancaster, CA 93535 and is currently estimated at $416,345, approximately $264 per square foot. 44830 13th St E is a home located in Los Angeles County with nearby schools including Discovery Elementary School, Piute Middle School, and Eastside High School.
Ownership History
Date
Name
Owned For
Owner Type
Purchase Details
Closed on
Mar 22, 2019
Sold by
Vilalon Rogers Elsa and Vilalon Rogers Elsa
Bought by
Rogers Elsa
Current Estimated Value
Home Financials for this Owner
Home Financials are based on the most recent Mortgage that was taken out on this home.
Original Mortgage
$177,500
Outstanding Balance
$155,575
Interest Rate
4.25%
Mortgage Type
Adjustable Rate Mortgage/ARM
Estimated Equity
$260,770
Purchase Details
Closed on
Feb 11, 2005
Sold by
Rogers Elsa Villalon and Rogers Brima
Bought by
Rogers Elsa Villalon
Home Financials for this Owner
Home Financials are based on the most recent Mortgage that was taken out on this home.
Original Mortgage
$198,750
Interest Rate
4.87%
Mortgage Type
Purchase Money Mortgage
Purchase Details
Closed on
Oct 28, 2002
Sold by
Mccleary Michael and Mccleary Shannon G
Bought by
Villalon Elsa
Home Financials for this Owner
Home Financials are based on the most recent Mortgage that was taken out on this home.
Original Mortgage
$142,025
Interest Rate
6.03%
Create a Home Valuation Report for This Property
The Home Valuation Report is an in-depth analysis detailing your home's value as well as a comparison with similar homes in the area
Home Values in the Area
Average Home Value in this Area
Purchase History
| Date | Buyer | Sale Price | Title Company |
|---|---|---|---|
| Rogers Elsa | -- | Old Republic Title Company | |
| Rogers Elsa Villalon | -- | North American Title | |
| Villalon Elsa | $149,500 | Chicago Title Co | |
| Villalon Elsa | -- | Chicago Title Co |
Source: Public Records
Mortgage History
| Date | Status | Borrower | Loan Amount |
|---|---|---|---|
| Open | Rogers Elsa | $177,500 | |
| Closed | Rogers Elsa Villalon | $198,750 | |
| Previous Owner | Villalon Elsa | $142,025 |
Source: Public Records
Tax History
| Year | Tax Paid | Tax Assessment Tax Assessment Total Assessment is a certain percentage of the fair market value that is determined by local assessors to be the total taxable value of land and additions on the property. | Land | Improvement |
|---|---|---|---|---|
| 2025 | $4,024 | $216,502 | $43,293 | $173,209 |
| 2024 | $4,024 | $212,258 | $42,445 | $169,813 |
| 2023 | $3,942 | $208,097 | $41,613 | $166,484 |
| 2022 | $3,741 | $204,018 | $40,798 | $163,220 |
| 2021 | $3,348 | $200,019 | $39,999 | $160,020 |
| 2019 | $3,256 | $194,088 | $38,813 | $155,275 |
| 2018 | $3,200 | $190,283 | $38,052 | $152,231 |
| 2016 | $3,037 | $182,896 | $36,575 | $146,321 |
| 2015 | $3,000 | $180,150 | $36,026 | $144,124 |
| 2014 | $2,859 | $166,000 | $33,200 | $132,800 |
Source: Public Records
Map
Nearby Homes
- 44840 Fenhold St
- 44919 Fenhold St
- 44910 12th St E
- 44727 Benald St
- 44827 Rock Island Dr
- 1129 Lightcap St
- 1304 E Avenue I Unit 8
- 1304 E Avenue I Unit 9
- 1304 E Avenue I Unit Spc 35
- 44662 Foxboro Ct
- 44633 Calston Ave
- 1213 Morven St
- 1609 Silvia Ave
- 44800 Denmore Ave
- 45050 Bevington Ave
- 44933 17th St E
- 44508 15th St E Unit 12
- 44520 Fenhold St
- 1639 E Kettering St
- 44544 15th St E Unit 9
- 44824 13th St E
- 44836 13th St E
- 1303 Lightcap St
- 44842 13th St E
- 44848 13th St E
- 44815 Benald St
- 44812 13th St E
- 44827 Benald St
- 44829 13th St E
- 1308 Landsford St
- 44835 13th St E
- 44823 13th St E
- 44841 13th St E
- 44817 13th St E
- 44854 13th St E
- 1314 Landsford St
- 1304 Lightcap St
- 44800 13th St E
- 44847 13th St E
- 44811 13th St E
Your Personal Tour Guide
Ask me questions while you tour the home.