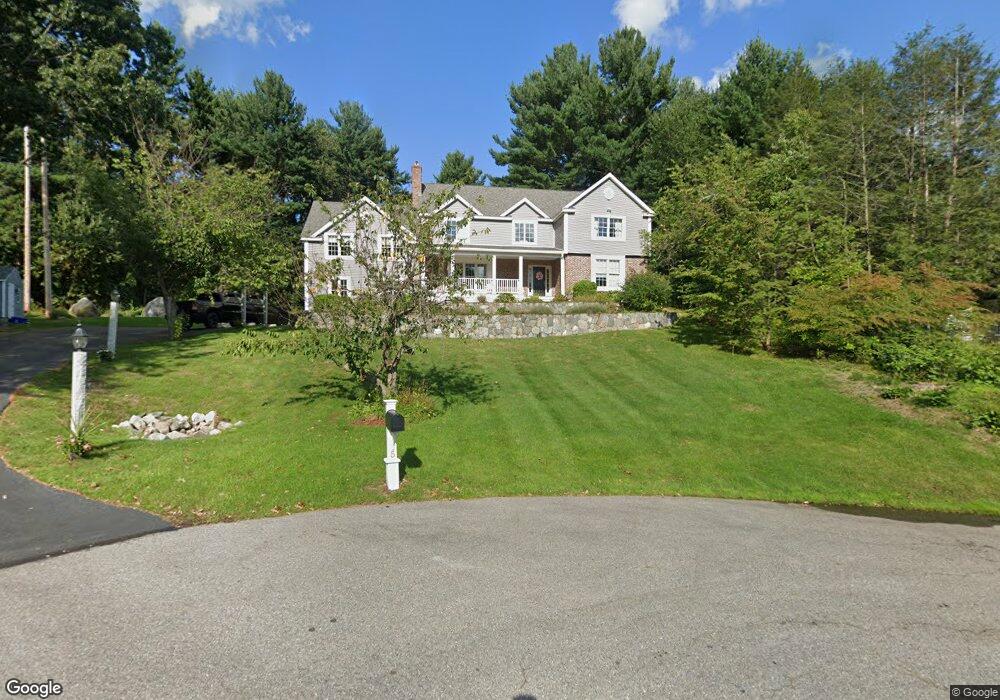
5 Cheyenne Cir Andover, MA 01810
West Andover NeighborhoodEstimated Value: $1,614,880 - $1,795,000
4
Beds
5
Baths
4,761
Sq Ft
$362/Sq Ft
Est. Value
About This Home
This home is located at 5 Cheyenne Cir, Andover, MA 01810 and is currently estimated at $1,722,720, approximately $361 per square foot. 5 Cheyenne Cir is a home located in Essex County with nearby schools including Henry C. Sanborn Elementary School, Andover West Middle School, and Andover High School.
Ownership History
Date
Name
Owned For
Owner Type
Purchase Details
Closed on
Dec 10, 1999
Sold by
Dougherty Gerard V and Dougherty Lisa E
Bought by
Mcgrotty Terence J and Mcgrotty Maeve
Current Estimated Value
Purchase Details
Closed on
Jun 26, 1997
Sold by
Gibson William L
Bought by
Dougherty Gerard
Purchase Details
Closed on
May 4, 1993
Sold by
Shawmut Bank
Bought by
Gibson William L
Create a Home Valuation Report for This Property
The Home Valuation Report is an in-depth analysis detailing your home's value as well as a comparison with similar homes in the area
Home Values in the Area
Average Home Value in this Area
Purchase History
| Date | Buyer | Sale Price | Title Company |
|---|---|---|---|
| Mcgrotty Terence J | $550,000 | -- | |
| Dougherty Gerard | $445,000 | -- | |
| Gibson William L | $377,500 | -- |
Source: Public Records
Mortgage History
| Date | Status | Borrower | Loan Amount |
|---|---|---|---|
| Open | Gibson William L | $583,000 | |
| Closed | Gibson William L | $583,000 | |
| Closed | Gibson William L | $400,000 |
Source: Public Records
Tax History Compared to Growth
Tax History
| Year | Tax Paid | Tax Assessment Tax Assessment Total Assessment is a certain percentage of the fair market value that is determined by local assessors to be the total taxable value of land and additions on the property. | Land | Improvement |
|---|---|---|---|---|
| 2024 | $18,019 | $1,399,000 | $665,500 | $733,500 |
| 2023 | $17,287 | $1,265,500 | $599,400 | $666,100 |
| 2022 | $16,307 | $1,116,900 | $521,300 | $595,600 |
| 2021 | $15,649 | $1,023,500 | $473,700 | $549,800 |
| 2020 | $15,057 | $1,003,100 | $462,000 | $541,100 |
| 2019 | $14,972 | $980,500 | $448,700 | $531,800 |
| 2018 | $14,444 | $923,500 | $431,400 | $492,100 |
| 2017 | $13,870 | $913,700 | $422,800 | $490,900 |
| 2016 | $13,585 | $916,700 | $422,800 | $493,900 |
| 2015 | $13,090 | $874,400 | $406,400 | $468,000 |
Source: Public Records
Map
Nearby Homes
- 4 Hazelwood Cir
- 18 Bryan Ln Unit 18
- 18 Dale St Unit 4G
- 105 Central St
- 103 Central St
- 47 Abbot St
- 3 West Hollow
- 31 Porter Rd
- 25 Timothy Dr
- 4 Hammond Way
- 15 Geneva Rd
- 14 Geneva Rd
- 37 Crenshaw Ln Unit 37
- 56 Sunset Rock Rd
- 58 Blanchard St
- 9 Chapman Ave
- Lot 7 Weeping Willow Dr
- 42 Stevens St
- 50 Hidden Rd
- 69 Blanchard St