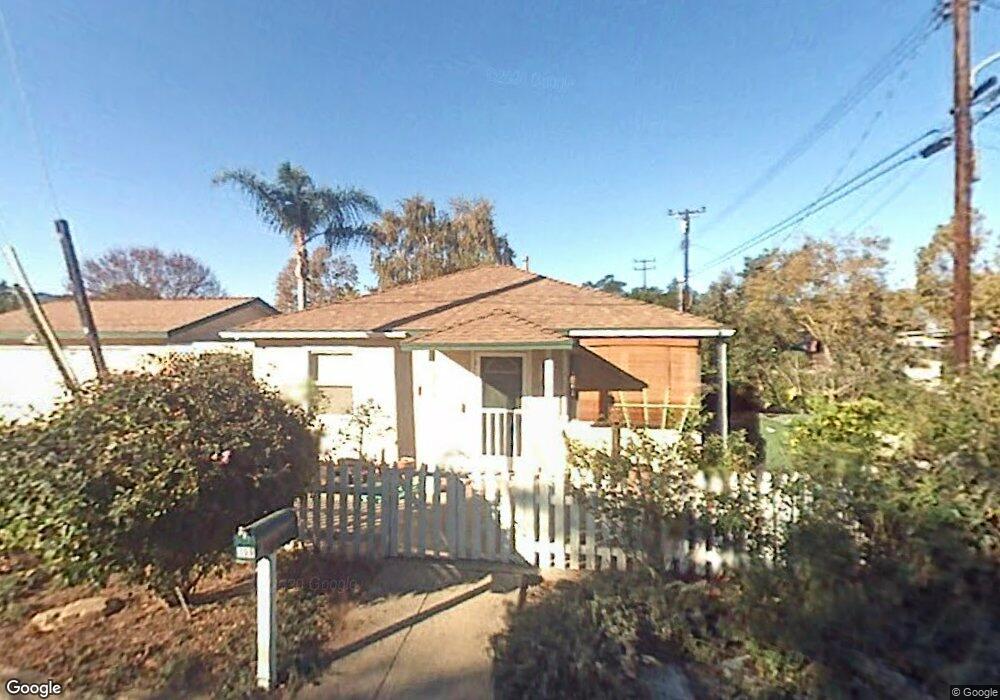
509 Vine St Oak View, CA 93022
Estimated Value: $617,000 - $681,000
2
Beds
1
Bath
624
Sq Ft
$1,045/Sq Ft
Est. Value
About This Home
This home is located at 509 Vine St, Oak View, CA 93022 and is currently estimated at $652,198, approximately $1,045 per square foot. 509 Vine St is a home located in Ventura County with nearby schools including Sunset Elementary School, De Anza Academy Of Technology And The Arts, and Ventura High School.
Ownership History
Date
Name
Owned For
Owner Type
Purchase Details
Closed on
Apr 27, 2017
Sold by
Stevens Theresa
Bought by
Rieb Michelle
Current Estimated Value
Home Financials for this Owner
Home Financials are based on the most recent Mortgage that was taken out on this home.
Original Mortgage
$247,900
Outstanding Balance
$204,846
Interest Rate
3.87%
Mortgage Type
Adjustable Rate Mortgage/ARM
Estimated Equity
$447,352
Purchase Details
Closed on
Jan 20, 2011
Sold by
Stevens Theresa
Bought by
Stevens Theresa and Stevens Mark Harold
Purchase Details
Closed on
Jan 7, 2011
Sold by
Stevens Theresa
Bought by
Stevens Theresa
Purchase Details
Closed on
Oct 25, 2002
Sold by
Chapman Robert Stephen
Bought by
Stevens Theresa
Home Financials for this Owner
Home Financials are based on the most recent Mortgage that was taken out on this home.
Original Mortgage
$231,200
Interest Rate
6.06%
Purchase Details
Closed on
Dec 11, 2000
Sold by
Morrison Margaret M
Bought by
Chapman Robert Stephen
Purchase Details
Closed on
Jun 21, 1999
Sold by
Morelli Dennis Judy
Bought by
Chapman Robert Stephen and Chapman Margaret M
Home Financials for this Owner
Home Financials are based on the most recent Mortgage that was taken out on this home.
Original Mortgage
$157,943
Interest Rate
7.05%
Mortgage Type
FHA
Purchase Details
Closed on
Jan 26, 1995
Sold by
Bucaria Charlotte and Frey Eleanor
Bought by
Bashford Dennis R and Bashford Elaine
Home Financials for this Owner
Home Financials are based on the most recent Mortgage that was taken out on this home.
Original Mortgage
$93,050
Interest Rate
8.9%
Purchase Details
Closed on
Jan 8, 1965
Sold by
Bashford Dennis R and Bashford Elaine
Bought by
Morelli Dennis and Morelli Judy
Home Financials for this Owner
Home Financials are based on the most recent Mortgage that was taken out on this home.
Original Mortgage
$129,080
Interest Rate
7.04%
Mortgage Type
FHA
Create a Home Valuation Report for This Property
The Home Valuation Report is an in-depth analysis detailing your home's value as well as a comparison with similar homes in the area
Home Values in the Area
Average Home Value in this Area
Purchase History
| Date | Buyer | Sale Price | Title Company |
|---|---|---|---|
| Rieb Michelle | $370,000 | Fidelity National Title | |
| Stevens Theresa | -- | None Available | |
| Stevens Theresa | -- | Chicago Title Company | |
| Stevens Theresa | -- | Chicago Title Company | |
| Stevens Theresa | $289,000 | Fidelity National Title Co | |
| Chapman Robert Stephen | -- | -- | |
| Chapman Robert Stephen | $159,000 | Old Republic Title Company | |
| Bashford Dennis R | -- | Chicago Title Co | |
| Morelli Dennis | $130,500 | Chicago Title Co |
Source: Public Records
Mortgage History
| Date | Status | Borrower | Loan Amount |
|---|---|---|---|
| Open | Rieb Michelle | $247,900 | |
| Previous Owner | Stevens Theresa | $231,200 | |
| Previous Owner | Chapman Robert Stephen | $157,943 | |
| Previous Owner | Bashford Dennis R | $93,050 | |
| Previous Owner | Morelli Dennis | $129,080 |
Source: Public Records
Tax History
| Year | Tax Paid | Tax Assessment Tax Assessment Total Assessment is a certain percentage of the fair market value that is determined by local assessors to be the total taxable value of land and additions on the property. | Land | Improvement |
|---|---|---|---|---|
| 2025 | $5,410 | $429,410 | $279,119 | $150,291 |
| 2024 | $5,410 | $420,991 | $273,646 | $147,345 |
| 2023 | $5,321 | $412,737 | $268,281 | $144,456 |
| 2022 | $5,021 | $404,645 | $263,021 | $141,624 |
| 2021 | $4,931 | $396,711 | $257,863 | $138,848 |
| 2020 | $4,874 | $392,645 | $255,220 | $137,425 |
| 2019 | $4,780 | $384,947 | $250,216 | $134,731 |
| 2018 | $4,694 | $377,400 | $245,310 | $132,090 |
| 2017 | $4,511 | $360,640 | $268,301 | $92,339 |
| 2016 | $4,285 | $339,000 | $252,000 | $87,000 |
| 2015 | $4,254 | $336,000 | $250,000 | $86,000 |
| 2014 | $3,895 | $302,000 | $225,000 | $77,000 |
Source: Public Records
Map
Nearby Homes
- 543 Good Hope St
- 385 Sunset Ave
- 109 Portal St
- 110 E Oak View Ave
- 182 Mountain View St
- 130 Olive St
- 1125 Spring St
- 75 Maxine Ave
- 10505 Dale Ave
- 358 Sunset Ct
- 700 Thomas St
- 1176 N Ventura Ave
- 0 Thomas St
- 350 Riverside Rd
- 10681 Encino Dr
- 401 Burnham Rd
- 10920 Ventura Ave
- 10980 N Ventura Ave
- 10945 Alto Ct
- 10995 Alto Ct
- 326 Larmier Ave
- 352 Larmier Ave
- 290 Larmier Ave
- 522 Good Hope St
- 544 Good Hope St
- 542 Vine St
- 543 Vine St
- 386 Larmier Ave
- 311 Larmier Ave
- 305 Larmier Ave
- 522 Vine St
- 351 Larmier Ave
- 544 Vine St
- 561 Vine St
- 264 266 Larmier Ave
- 264 Larmier Ave
- 568 Good Hope St
- 385 Larmier Ave
- 267 Larmier Ave
- 582 Vine St
Your Personal Tour Guide
Ask me questions while you tour the home.