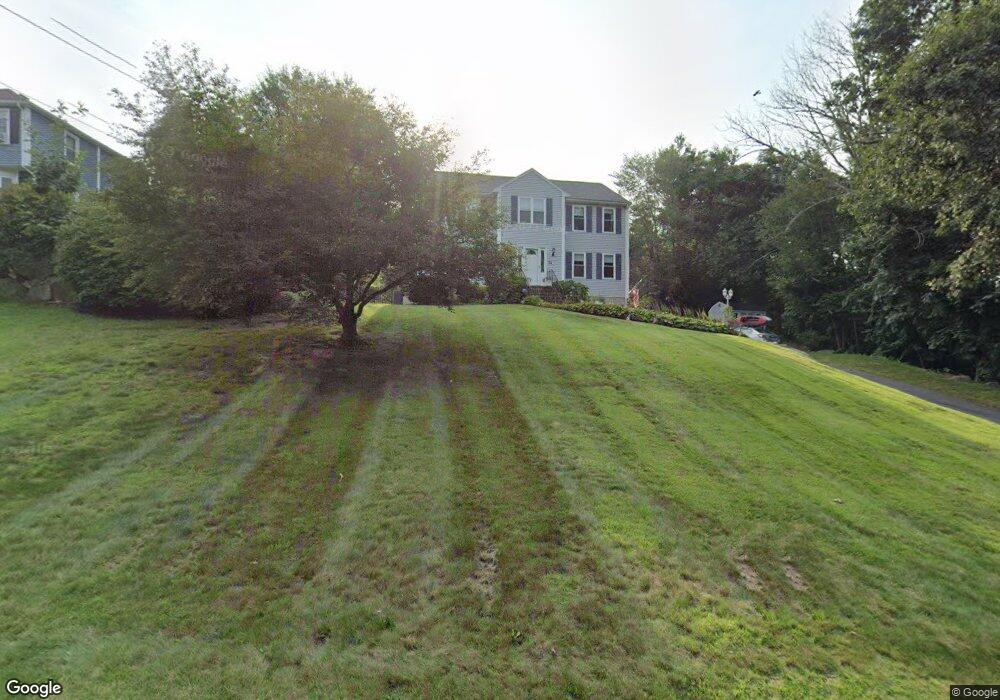
52 Mark Dr Milford, MA 01757
Estimated Value: $677,000 - $711,000
4
Beds
3
Baths
2,166
Sq Ft
$320/Sq Ft
Est. Value
About This Home
This home is located at 52 Mark Dr, Milford, MA 01757 and is currently estimated at $693,566, approximately $320 per square foot. 52 Mark Dr is a home located in Worcester County with nearby schools including Milford High School.
Ownership History
Date
Name
Owned For
Owner Type
Purchase Details
Closed on
Sep 22, 2003
Sold by
Fahey Cheryl K and Kennedy Cheryl L
Bought by
Fahey Cheryl K and Fahey Cheryl L
Current Estimated Value
Purchase Details
Closed on
Aug 21, 1996
Sold by
Grason Builders Inc
Bought by
Kennedy Cheryl and Fahey Michael
Purchase Details
Closed on
Nov 9, 1995
Sold by
Florence Pyne Rt and Pyne Florence
Bought by
Grason Builders Inc
Purchase Details
Closed on
Aug 22, 1990
Sold by
Pyne Investment Trust
Bought by
Florence J Pyne Rt
Purchase Details
Closed on
Mar 26, 1990
Sold by
Home Natl Bk Milf
Bought by
Ryan Oscar J
Purchase Details
Closed on
Jan 30, 1990
Sold by
Grumbach Stephen
Bought by
Herbert Wayne
Purchase Details
Closed on
Aug 22, 1989
Sold by
Laurel Service Grou
Bought by
Grumbach Stephan
Purchase Details
Closed on
Aug 10, 1989
Sold by
Laurel Serv Group
Bought by
Mcinnis William
Purchase Details
Closed on
Nov 27, 1987
Sold by
Canedella Rlty Tr
Bought by
Barbee Richard A
Create a Home Valuation Report for This Property
The Home Valuation Report is an in-depth analysis detailing your home's value as well as a comparison with similar homes in the area
Home Values in the Area
Average Home Value in this Area
Purchase History
| Date | Buyer | Sale Price | Title Company |
|---|---|---|---|
| Fahey Cheryl K | -- | -- | |
| Kennedy Cheryl | $201,000 | -- | |
| Grason Builders Inc | $75,000 | -- | |
| Florence J Pyne Rt | $40,000 | -- | |
| Ryan Oscar J | $45,000 | -- | |
| Herbert Wayne | $170,000 | -- | |
| Grumbach Stephan | $65,000 | -- | |
| Mcinnis William | $55,000 | -- | |
| Barbee Richard A | $252,500 | -- |
Source: Public Records
Mortgage History
| Date | Status | Borrower | Loan Amount |
|---|---|---|---|
| Open | Barbee Richard A | $195,550 | |
| Previous Owner | Barbee Richard A | $170,000 |
Source: Public Records
Tax History Compared to Growth
Tax History
| Year | Tax Paid | Tax Assessment Tax Assessment Total Assessment is a certain percentage of the fair market value that is determined by local assessors to be the total taxable value of land and additions on the property. | Land | Improvement |
|---|---|---|---|---|
| 2025 | $7,331 | $572,700 | $216,300 | $356,400 |
| 2024 | $7,308 | $549,900 | $207,600 | $342,300 |
| 2023 | $6,884 | $476,400 | $179,500 | $296,900 |
| 2022 | $6,568 | $426,800 | $164,400 | $262,400 |
| 2021 | $6,342 | $396,900 | $164,400 | $232,500 |
| 2020 | $6,269 | $392,800 | $164,400 | $228,400 |
| 2019 | $6,108 | $369,300 | $164,400 | $204,900 |
| 2018 | $6,044 | $365,000 | $160,100 | $204,900 |
| 2017 | $5,871 | $349,700 | $160,100 | $189,600 |
| 2016 | $5,786 | $336,800 | $160,100 | $176,700 |
| 2015 | $5,651 | $322,000 | $151,400 | $170,600 |
Source: Public Records
Map
Nearby Homes
- 250 Congress St
- 54 Village Cir Unit 54
- 44 Woodridge Rd
- 9 Robin Rd
- 44 Silver Hill Rd
- 56 Village Cir
- 13 Hemlock Ln
- 20 Senate Rd
- 8 Vassar Dr
- 1 Tyler St
- 8 Colonial Rd
- 5 Stanford Cir
- 6 Geneseo Cir
- 24 Camp St
- 4 Kennedy Ln Unit 49
- 21 Shadowbrook Ln Unit 13
- 62 Field Pond Rd
- 10 Shadowbrook Ln Unit 24
- 4 Shadowbrook Ln Unit 31
- 8 Shadowbrook Ln Unit 39