523 E 8th St Duluth, MN 55805
Central Hillside NeighborhoodEstimated Value: $185,000 - $215,565
3
Beds
3
Baths
1,320
Sq Ft
$152/Sq Ft
Est. Value
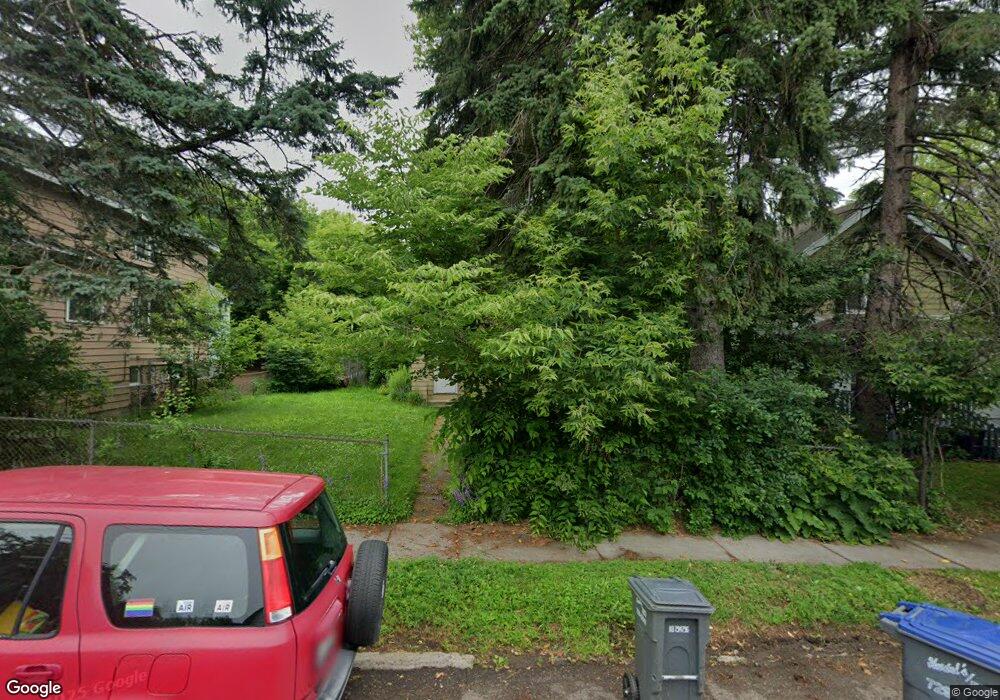
About This Home
This home is located at 523 E 8th St, Duluth, MN 55805 and is currently estimated at $200,891, approximately $152 per square foot. 523 E 8th St is a home located in St. Louis County with nearby schools including Myers-Wilkins Elementary, Lincoln Park Middle School, and Denfeld High School.
Ownership History
Date
Name
Owned For
Owner Type
Purchase Details
Closed on
Nov 8, 2011
Sold by
Najjar Crystal A and Linge Crystal A
Bought by
Houwman Nickolaus O
Current Estimated Value
Home Financials for this Owner
Home Financials are based on the most recent Mortgage that was taken out on this home.
Original Mortgage
$71,392
Outstanding Balance
$47,863
Interest Rate
3.75%
Mortgage Type
FHA
Estimated Equity
$153,028
Create a Home Valuation Report for This Property
The Home Valuation Report is an in-depth analysis detailing your home's value as well as a comparison with similar homes in the area
Home Values in the Area
Average Home Value in this Area
Purchase History
| Date | Buyer | Sale Price | Title Company |
|---|---|---|---|
| Houwman Nickolaus O | $73,251 | Rels Title |
Source: Public Records
Mortgage History
| Date | Status | Borrower | Loan Amount |
|---|---|---|---|
| Open | Houwman Nickolaus O | $71,392 |
Source: Public Records
Tax History
| Year | Tax Paid | Tax Assessment Tax Assessment Total Assessment is a certain percentage of the fair market value that is determined by local assessors to be the total taxable value of land and additions on the property. | Land | Improvement |
|---|---|---|---|---|
| 2024 | $2,446 | $177,200 | $25,400 | $151,800 |
| 2023 | $2,446 | $158,700 | $30,300 | $128,400 |
| 2022 | $1,854 | $146,100 | $28,000 | $118,100 |
| 2021 | $1,496 | $133,900 | $25,900 | $108,000 |
| 2020 | $1,354 | $115,300 | $22,400 | $92,900 |
| 2019 | $1,346 | $105,000 | $20,300 | $84,700 |
| 2018 | $1,228 | $105,000 | $20,300 | $84,700 |
| 2017 | $864 | $103,700 | $20,400 | $83,300 |
| 2016 | $848 | $109,600 | $12,700 | $96,900 |
| 2015 | $1,267 | $81,600 | $8,300 | $73,300 |
| 2014 | $1,267 | $81,600 | $8,300 | $73,300 |
Source: Public Records
Map
Nearby Homes
- 409 E 6th St
- 609 N 4th Ave E
- 517 E 5th St
- 706 E 11th St
- 1125 N 7th Ave E
- 1126 Mesaba Ave Unit 119
- 202 E 7th St Unit D
- 917 E 7th St
- 722 E 3rd St
- XXX E Ninth St
- 523 N 1st Ave E
- 908 E Skyline Pkwy
- 1027 E 9th St
- 1023 E 5th St
- 902 N 11th Ave E
- 1011 N 12th Ave E
- 311 E Superior St Unit 704
- 311 E Superior St Unit 905
- 311 E Superior St
- 1205 E 3rd St
Your Personal Tour Guide
Ask me questions while you tour the home.