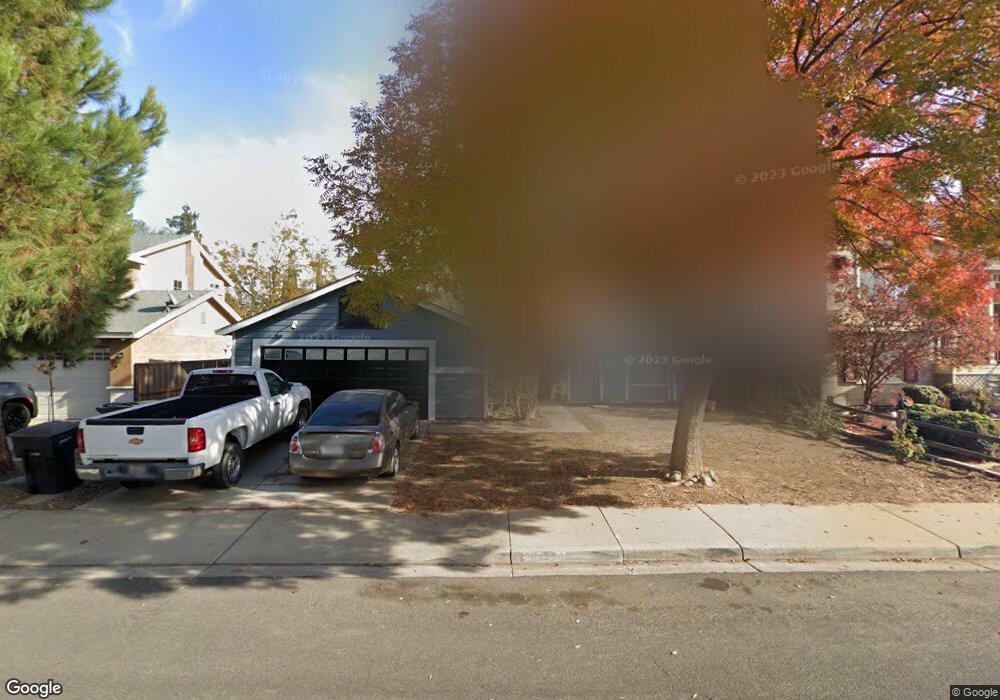
552 Moray Way Patterson, CA 95363
Estimated Value: $373,000 - $436,000
About This Home
This home is located at 552 Moray Way, Patterson, CA 95363 and is currently estimated at $418,321, approximately $280 per square foot. 552 Moray Way is a home located in Stanislaus County with nearby schools including Las Palmas Elementary School, Creekside Middle School, and Patterson High School.
Ownership History
We collect this data history from publicly available records. To have your information removed, we recommend requesting removal directly through your county’s website.
Purchase Details
Home Financials for this Owner
Home Financials are based on the most recent Mortgage that was taken out on this home.Purchase Details
Home Financials for this Owner
Home Financials are based on the most recent Mortgage that was taken out on this home.Purchase Details
Purchase Details
Purchase Details
Home Values in the Area
Average Home Value in this Area
Purchase History
We collect this data history from publicly available records. To have your information removed, we recommend requesting removal directly through your county’s website.
| Date | Buyer | Sale Price | Title Company |
|---|---|---|---|
| $118,000 | North American Title Co | ||
| -- | North American Title Co | ||
| -- | Fidelity National Title Ins | ||
| $121,849 | -- | ||
| -- | -- |
Mortgage History
We collect this data history from publicly available records. To have your information removed, we recommend requesting removal directly through your county’s website.
| Date | Status | Borrower | Loan Amount |
|---|---|---|---|
| Open | $117,792 | ||
| Closed | $7,080 |
Tax History
We collect this data history from publicly available records. To have your information removed, we recommend requesting removal directly through your county’s website.
| Year | Tax Paid | Tax Assessment Tax Assessment Total Assessment is a certain percentage of the fair market value that is determined by local assessors to be the total taxable value of land and additions on the property. | Land | Improvement |
|---|---|---|---|---|
| 2025 | $2,121 | $181,339 | $38,415 | $142,924 |
| 2024 | $2,114 | $177,784 | $37,662 | $140,122 |
| 2023 | $2,067 | $174,299 | $36,924 | $137,375 |
| 2022 | $1,952 | $170,882 | $36,200 | $134,682 |
| 2021 | $1,936 | $167,533 | $35,491 | $132,042 |
| 2020 | $1,925 | $165,817 | $35,128 | $130,689 |
| 2019 | $1,895 | $162,567 | $34,440 | $128,127 |
| 2018 | $1,806 | $159,380 | $33,765 | $125,615 |
| 2017 | $1,768 | $156,255 | $33,103 | $123,152 |
| 2016 | $1,721 | $153,192 | $32,454 | $120,738 |
| 2015 | $1,660 | $150,892 | $31,967 | $118,925 |
| 2014 | $1,623 | $147,937 | $31,341 | $116,596 |
Map
- 708 Bonneau Ct
- 850 Miraggio Dr
- 505 Tuscany Ct
- 855 Toyon Ln
- 1117 Van Gogh Ln
- 1126 Gardenia Ct
- 109 James Burke Ave
- 301 Orange Blossom Ln
- 1132 Marsh Wren Ct
- 201 N 7th St
- 1212 Shearwater Dr
- 10037 California 33
- 17 Walker Ranch Pkwy
- 403 Elfers Rd
- 425 Elfers Rd
- 0 Locust Ave
- 1314 Sutter Creek Ct
- 528 N 4th St
- 220 Abelia Ln
- 601 N 4th St
Ask me questions while you tour the home.