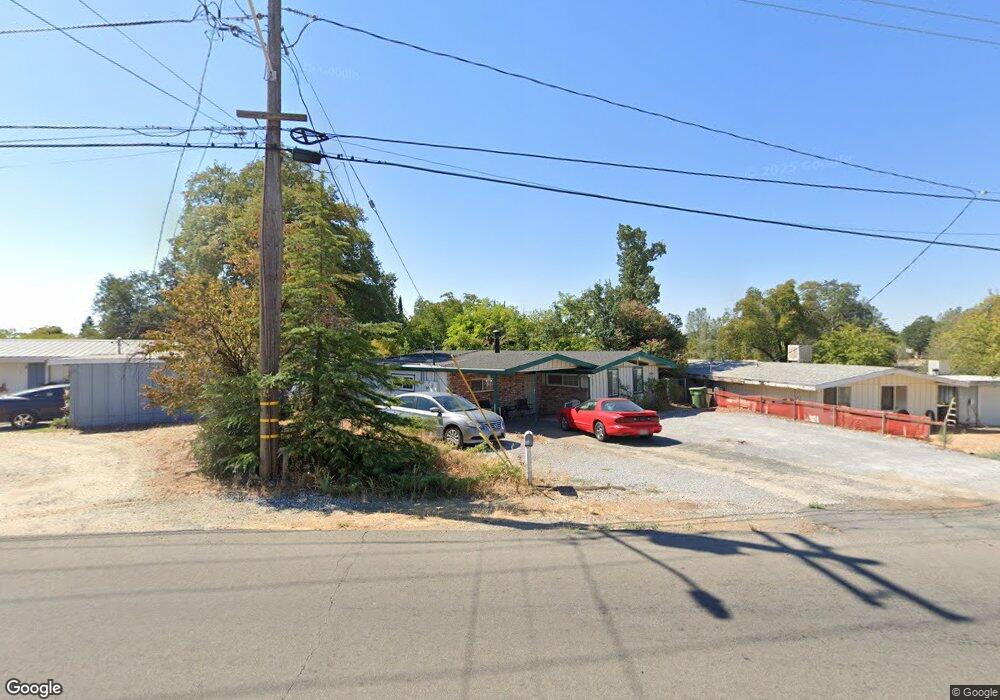
5607 Mountain View Dr Redding, CA 96003
Midway NeighborhoodEstimated Value: $323,503 - $342,000
3
Beds
2
Baths
1,507
Sq Ft
$221/Sq Ft
Est. Value
About This Home
This home is located at 5607 Mountain View Dr, Redding, CA 96003 and is currently estimated at $332,376, approximately $220 per square foot. 5607 Mountain View Dr is a home located in Shasta County with nearby schools including Shasta View Academy, Bethel Christian School, and Country Christian School.
Ownership History
Date
Name
Owned For
Owner Type
Purchase Details
Closed on
Jul 17, 2015
Sold by
Lemire Michelle A
Bought by
Crisp Kenneth
Current Estimated Value
Home Financials for this Owner
Home Financials are based on the most recent Mortgage that was taken out on this home.
Original Mortgage
$60,995
Outstanding Balance
$47,808
Interest Rate
4.01%
Mortgage Type
New Conventional
Estimated Equity
$284,568
Purchase Details
Closed on
Jul 28, 2005
Sold by
Cibula Franklin S
Bought by
Crisp Kenneth
Purchase Details
Closed on
Oct 8, 2003
Sold by
Randell Debra L
Bought by
Cibula Franklin S
Purchase Details
Closed on
Apr 16, 2001
Sold by
Baker Frederick D and Baker Martha A
Bought by
Randell Debra L
Home Financials for this Owner
Home Financials are based on the most recent Mortgage that was taken out on this home.
Original Mortgage
$50,400
Interest Rate
7.24%
Purchase Details
Closed on
Nov 28, 2000
Sold by
Baker Frederick D
Bought by
Baker Frederick D and Baker Martha A
Create a Home Valuation Report for This Property
The Home Valuation Report is an in-depth analysis detailing your home's value as well as a comparison with similar homes in the area
Home Values in the Area
Average Home Value in this Area
Purchase History
| Date | Buyer | Sale Price | Title Company |
|---|---|---|---|
| Crisp Kenneth | -- | None Available | |
| Crisp Kenneth | $209,000 | Alliance Title Company | |
| Cibula Franklin S | -- | -- | |
| Randell Debra L | $63,000 | First American Title Co | |
| Baker Frederick D | -- | -- |
Source: Public Records
Mortgage History
| Date | Status | Borrower | Loan Amount |
|---|---|---|---|
| Open | Crisp Kenneth | $60,995 | |
| Previous Owner | Randell Debra L | $50,400 | |
| Closed | Randell Debra L | $3,000 |
Source: Public Records
Tax History
| Year | Tax Paid | Tax Assessment Tax Assessment Total Assessment is a certain percentage of the fair market value that is determined by local assessors to be the total taxable value of land and additions on the property. | Land | Improvement |
|---|---|---|---|---|
| 2025 | $3,002 | $285,593 | $109,315 | $176,278 |
| 2024 | $2,944 | $279,994 | $107,172 | $172,822 |
| 2023 | $2,944 | $274,505 | $105,071 | $169,434 |
| 2022 | $2,864 | $269,123 | $103,011 | $166,112 |
| 2021 | $2,825 | $263,847 | $100,992 | $162,855 |
| 2020 | $2,145 | $200,000 | $50,000 | $150,000 |
| 2019 | $2,120 | $200,000 | $50,000 | $150,000 |
| 2018 | $1,721 | $160,000 | $50,000 | $110,000 |
| 2017 | $1,615 | $150,000 | $45,000 | $105,000 |
| 2016 | $1,521 | $145,000 | $40,000 | $105,000 |
| 2015 | $1,445 | $138,000 | $35,000 | $103,000 |
| 2014 | $1,284 | $120,000 | $30,000 | $90,000 |
Source: Public Records
Map
Nearby Homes
- 5570 Mountain View Dr
- 846 Ridge Rd
- 5536 Trish Ct
- 1050 Hillsdale Ct
- 5663 Terra Linda Way
- 5976 Sierra Dr
- 5513 Diamond Ridge Dr
- 5961 Sierra Dr
- 581 N Boulder Dr
- 948 & 950 Hawley
- 5721 Beaumont Dr
- 5890 Shadow Glen Dr
- 633 Marijean Way
- 465 Silkwood Dr
- 420 Silkwood Dr
- 1180 Jaxon Way
- 6040 Constitution Way
- 1131 Redwood Blvd
- 481 Twin View Blvd
- 362 Lemon Dr
- 5617 Mountain View Dr
- 5595 Mountain View Dr
- 5622 Cascade Dr
- 5627 Mountain View Dr
- 5610 Cascade Dr
- 5634 Cascade Dr
- 5635 Mountain View Dr
- 5580 Mountain View Dr
- 5648 Cascade Dr
- 5636 Mountain View Dr
- 5647 Mountain View Dr
- 5601 Cascade Dr
- 5576 Mountain View Dr
- 5636 Mountain View
- 5654 Cascade Dr
- 5622 Mountain View Dr
- 5657 Mountain View Dr
- 5625 Cascade Dr
- 5654 Mountain View Dr
- 5637 Cascade Dr
Your Personal Tour Guide
Ask me questions while you tour the home.