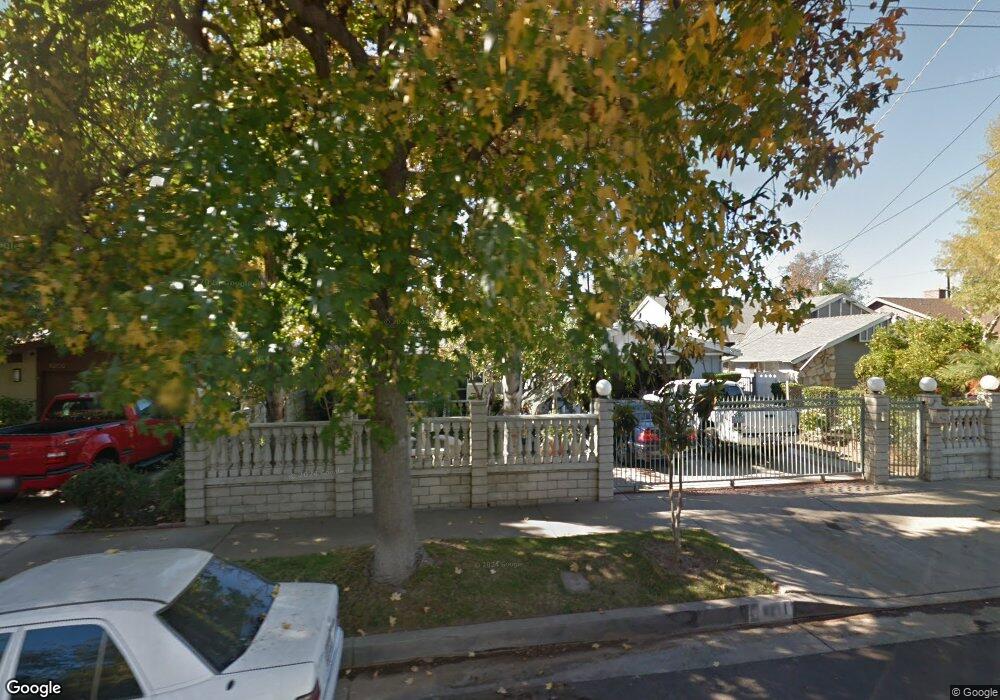
6211 Ranchito Ave van Nuys, CA 91401
Estimated Value: $1,134,000 - $1,306,000
4
Beds
2
Baths
2,059
Sq Ft
$580/Sq Ft
Est. Value
About This Home
This home is located at 6211 Ranchito Ave, van Nuys, CA 91401 and is currently estimated at $1,194,102, approximately $579 per square foot. 6211 Ranchito Ave is a home located in Los Angeles County with nearby schools including Erwin Street Elementary School, Van Nuys High School, and Ararat Charter School.
Ownership History
Date
Name
Owned For
Owner Type
Purchase Details
Closed on
Jun 23, 2017
Sold by
Khostegyan Armenui Amy
Bought by
Khostegyan Harutyun
Current Estimated Value
Home Financials for this Owner
Home Financials are based on the most recent Mortgage that was taken out on this home.
Original Mortgage
$424,100
Outstanding Balance
$352,763
Interest Rate
4.02%
Mortgage Type
New Conventional
Estimated Equity
$841,339
Purchase Details
Closed on
Oct 10, 2014
Sold by
Khostegyan Harutyun
Bought by
Khostegyan Harutyun
Purchase Details
Closed on
Apr 3, 2014
Sold by
Khostegyan Maro
Bought by
Khostegyan Maro and The Living Trust Of Maro Khostegyan
Purchase Details
Closed on
Apr 21, 1998
Sold by
Khostegyan Maro
Bought by
Khostegyan Maro
Home Financials for this Owner
Home Financials are based on the most recent Mortgage that was taken out on this home.
Original Mortgage
$176,250
Interest Rate
7.06%
Create a Home Valuation Report for This Property
The Home Valuation Report is an in-depth analysis detailing your home's value as well as a comparison with similar homes in the area
Home Values in the Area
Average Home Value in this Area
Purchase History
| Date | Buyer | Sale Price | Title Company |
|---|---|---|---|
| Khostegyan Harutyun | -- | Lawyers Title | |
| Khostegyan Harutyun | -- | None Available | |
| Khostegyan Maro | -- | None Available | |
| Khostegyan Maro | -- | Fidelity National Title |
Source: Public Records
Mortgage History
| Date | Status | Borrower | Loan Amount |
|---|---|---|---|
| Open | Khostegyan Harutyun | $424,100 | |
| Previous Owner | Khostegyan Maro | $176,250 |
Source: Public Records
Tax History Compared to Growth
Tax History
| Year | Tax Paid | Tax Assessment Tax Assessment Total Assessment is a certain percentage of the fair market value that is determined by local assessors to be the total taxable value of land and additions on the property. | Land | Improvement |
|---|---|---|---|---|
| 2025 | $4,969 | $390,436 | $132,155 | $258,281 |
| 2024 | $4,969 | $382,781 | $129,564 | $253,217 |
| 2023 | $4,878 | $375,276 | $127,024 | $248,252 |
| 2022 | $4,658 | $367,919 | $124,534 | $243,385 |
| 2021 | $4,593 | $360,706 | $122,093 | $238,613 |
| 2019 | $4,461 | $350,010 | $118,473 | $231,537 |
| 2018 | $4,326 | $343,148 | $116,150 | $226,998 |
| 2016 | $4,119 | $329,826 | $111,641 | $218,185 |
| 2015 | $4,060 | $324,873 | $109,965 | $214,908 |
| 2014 | $3,996 | $318,510 | $107,811 | $210,699 |
Source: Public Records
Map
Nearby Homes
- 6156 Colbath Ave
- 13831 Bessemer St
- 13817 Bessemer St
- 13816 Bessemer St
- 14019 Bessemer St
- 6240 Hazeltine Ave
- 6226 Mammoth Ave
- 6350 Costello Ave
- 13801 Oxnard St Unit 202
- 13801 Oxnard St Unit 206
- 6255 Woodman Ave Unit 203
- 14005 Victory Blvd
- 14121 Friar St
- 5934 Murietta Ave
- 13621 Erwin St
- 13633 Sylvan St
- 14206 Calvert St
- 5934 Murrieta
- 5919 - 5921 Cantaloupe Ave
- 14218 Sylvan St
- 6209 Ranchito Ave
- 6219 Ranchito Ave
- 6201 Ranchito Ave
- 6223 Ranchito Ave
- 6218 Colbath Ave
- 6206 Colbath Ave
- 6177 Ranchito Ave
- 6224 Colbath Ave
- 6229 Ranchito Ave
- 6200 Colbath Ave
- 6176 Colbath Ave
- 6171 Ranchito Ave
- 6200 Ranchito Ave
- 6230 Colbath Ave
- 6216 Ranchito Ave
- 6170 Colbath Ave
- 13906 Sylvan St
- 6222 Ranchito Ave
- 6167 Ranchito Ave
- 13914 Sylvan St