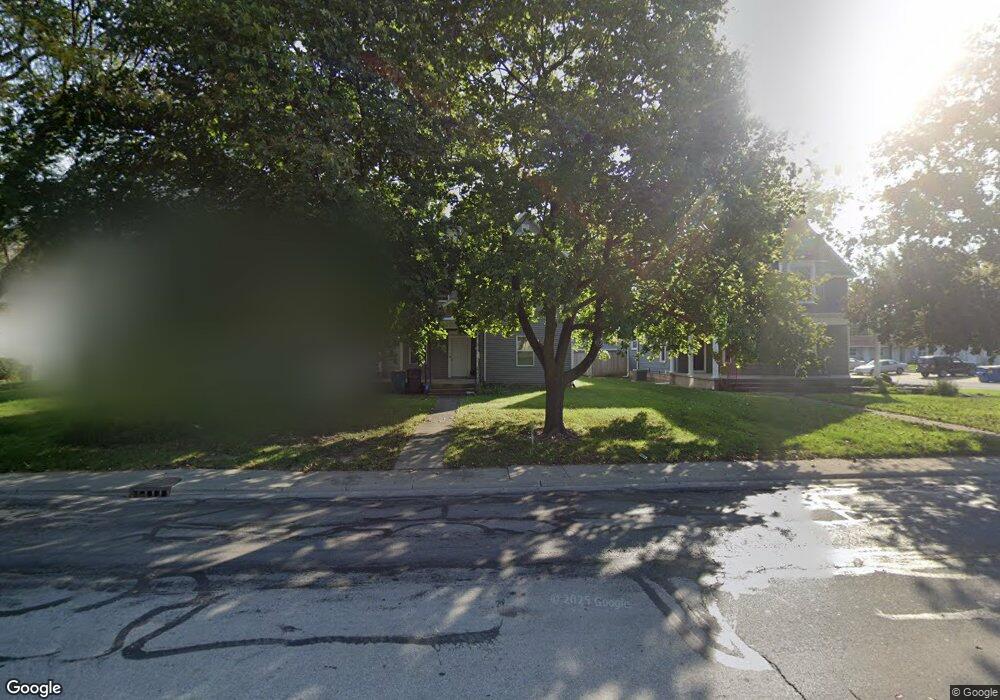
623 S Main St Bluffton, IN 46714
Estimated Value: $103,000 - $135,744
3
Beds
2
Baths
3,641
Sq Ft
$32/Sq Ft
Est. Value
About This Home
This home is located at 623 S Main St, Bluffton, IN 46714 and is currently estimated at $117,686, approximately $32 per square foot. 623 S Main St is a home located in Wells County with nearby schools including Bluffton-Harrison Elementary School, Bluffton-Harrison Middle School, and Bluffton High School.
Ownership History
Date
Name
Owned For
Owner Type
Purchase Details
Closed on
Oct 8, 2019
Sold by
Trinity Properties Llc
Bought by
Bcg Capital Llc
Current Estimated Value
Home Financials for this Owner
Home Financials are based on the most recent Mortgage that was taken out on this home.
Original Mortgage
$86,000
Outstanding Balance
$56,887
Interest Rate
3.5%
Mortgage Type
New Conventional
Estimated Equity
$60,799
Purchase Details
Closed on
Apr 24, 2018
Sold by
Eisaman Seth
Bought by
Trinity Properties Llc
Home Financials for this Owner
Home Financials are based on the most recent Mortgage that was taken out on this home.
Original Mortgage
$78,500
Interest Rate
4.44%
Mortgage Type
New Conventional
Purchase Details
Closed on
Nov 20, 1997
Sold by
Barr Maude E
Bought by
Lucabaugh Frederick L and Lucabaugh Jeri A
Create a Home Valuation Report for This Property
The Home Valuation Report is an in-depth analysis detailing your home's value as well as a comparison with similar homes in the area
Home Values in the Area
Average Home Value in this Area
Purchase History
We collect this data history from publicly available records. To have your information removed, we recommend requesting removal directly through your county’s website.
| Date | Buyer | Sale Price | Title Company |
|---|---|---|---|
| Bcg Capital Llc | $85,000 | Wells County Land Title | |
| Trinity Properties Llc | $77,000 | Wells County Title | |
| Lucabaugh Frederick L | $48,000 | -- |
Source: Public Records
Mortgage History
We collect this data history from publicly available records. To have your information removed, we recommend requesting removal directly through your county’s website.
| Date | Status | Borrower | Loan Amount |
|---|---|---|---|
| Open | Bcg Capital Llc | $86,000 | |
| Previous Owner | Trinity Properties Llc | $78,500 |
Source: Public Records
Tax History
| Year | Tax Paid | Tax Assessment Tax Assessment Total Assessment is a certain percentage of the fair market value that is determined by local assessors to be the total taxable value of land and additions on the property. | Land | Improvement |
|---|---|---|---|---|
| 2025 | $1,638 | $90,800 | $7,100 | $83,700 |
| 2024 | $1,638 | $90,800 | $8,200 | $82,600 |
| 2023 | $1,546 | $82,500 | $8,100 | $74,400 |
| 2022 | $1,371 | $79,800 | $5,300 | $74,500 |
| 2021 | $1,323 | $78,200 | $5,800 | $72,400 |
| 2020 | $1,176 | $78,200 | $5,100 | $73,100 |
| 2019 | $1,151 | $68,600 | $4,700 | $63,900 |
| 2018 | $1,146 | $68,600 | $4,800 | $63,800 |
| 2017 | $752 | $55,000 | $3,800 | $51,200 |
| 2016 | $828 | $55,000 | $4,300 | $50,700 |
| 2014 | $1,709 | $102,200 | $7,900 | $94,300 |
| 2013 | $659 | $42,100 | $7,600 | $34,500 |
Source: Public Records
Map
Nearby Homes
- 209 E Ohio St
- 404 W Wiley Ave
- 420 E Central Ave
- 412 E Cherry St
- 212 E Washington St
- 926 S Morgan St
- 419 W Market St
- 723 W Horton St
- 610 W Spring St
- 803 S Bond St
- 909 W Market St
- 1120 River Rd
- 219 N Union St
- 1128 W Cherry St
- 15 Columbian Ave
- 1240 Virginia Ct
- 1115 Ridgewood Ln
- 1323 Sunnyglenn Ct
- 3716 E River Rd
- 1407 Deerbrook Ct
Your Personal Tour Guide
Ask me questions while you tour the home.