Estimated Value: $375,000 - $461,000
3
Beds
2
Baths
1,347
Sq Ft
$321/Sq Ft
Est. Value
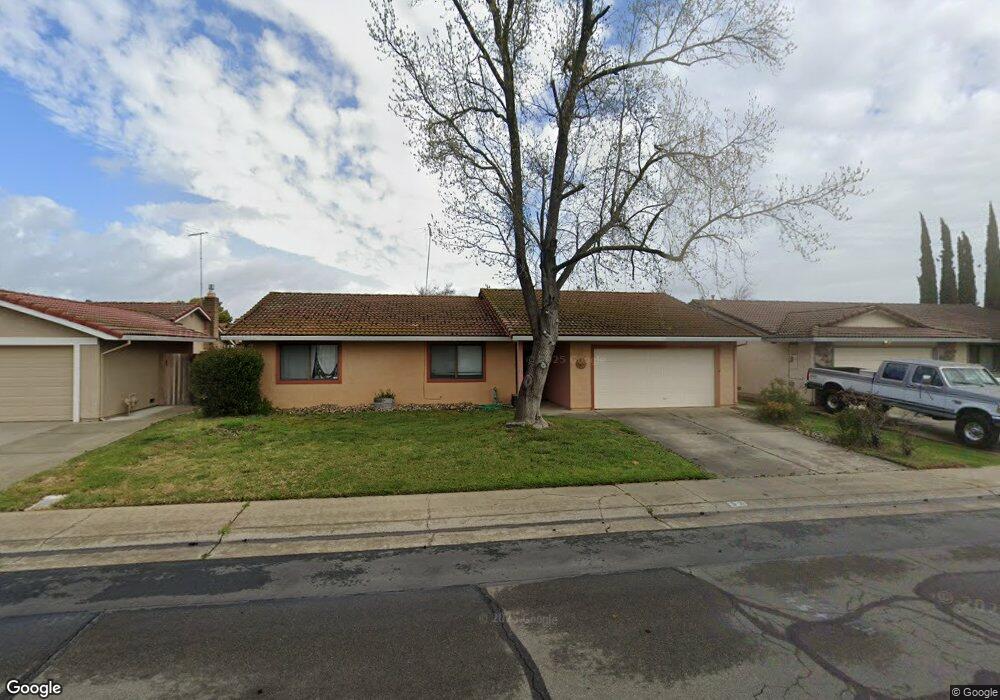
About This Home
This home is located at 67 Almo Ct, Galt, CA 95632 and is currently estimated at $432,323, approximately $320 per square foot. 67 Almo Ct is a home located in Sacramento County with nearby schools including Vernon E. Greer Elementary School, Robert L. McCaffrey Middle School, and Galt High School.
Ownership History
Date
Name
Owned For
Owner Type
Purchase Details
Closed on
Jun 5, 2001
Sold by
Hopper Marilyn Reece and Estate Of Mary Helen Reece Joh
Bought by
Brossman Christopher A and Brossman Frances J
Current Estimated Value
Home Financials for this Owner
Home Financials are based on the most recent Mortgage that was taken out on this home.
Original Mortgage
$137,700
Outstanding Balance
$52,453
Interest Rate
7.14%
Estimated Equity
$379,870
Create a Home Valuation Report for This Property
The Home Valuation Report is an in-depth analysis detailing your home's value as well as a comparison with similar homes in the area
Home Values in the Area
Average Home Value in this Area
Purchase History
| Date | Buyer | Sale Price | Title Company |
|---|---|---|---|
| Brossman Christopher A | $156,000 | Central Valley Title Company |
Source: Public Records
Mortgage History
| Date | Status | Borrower | Loan Amount |
|---|---|---|---|
| Open | Brossman Christopher A | $137,700 |
Source: Public Records
Tax History
| Year | Tax Paid | Tax Assessment Tax Assessment Total Assessment is a certain percentage of the fair market value that is determined by local assessors to be the total taxable value of land and additions on the property. | Land | Improvement |
|---|---|---|---|---|
| 2025 | $2,508 | $235,043 | $75,330 | $159,713 |
| 2024 | $2,508 | $230,435 | $73,853 | $156,582 |
| 2023 | $2,464 | $225,917 | $72,405 | $153,512 |
| 2022 | $2,363 | $221,488 | $70,986 | $150,502 |
| 2021 | $2,365 | $217,146 | $69,595 | $147,551 |
| 2020 | $2,344 | $214,921 | $68,882 | $146,039 |
| 2019 | $2,285 | $210,708 | $67,532 | $143,176 |
| 2018 | $2,280 | $206,577 | $66,208 | $140,369 |
| 2017 | $2,189 | $202,527 | $64,910 | $137,617 |
| 2016 | $2,101 | $198,557 | $63,638 | $134,919 |
| 2015 | $2,028 | $195,576 | $62,683 | $132,893 |
| 2014 | $2,021 | $191,746 | $61,456 | $130,290 |
Source: Public Records
Map
Nearby Homes
- 323 Emerald Oak Dr
- 0 B St Unit 226013319
- 150 Spruce Ave
- 192 Oakwilde St
- 113 4th St
- 240 3rd St
- 150 Branding Iron Way
- 232 Oak Ave
- 246 Oak Ave
- 229 Sandpiper Dr
- 219 Lois Ave
- 350 Palin Ave
- 402 Alpen Rose Way
- Plan 1609 at Elliott Ranch - Sage
- Plan 2290 at Elliott Ranch - Willow
- Plan 2141 at Elliott Ranch - Sage
- Plan 2015 at Elliott Ranch - Willow
- Plan 1760 at Elliott Ranch - Sage
- Plan 2741 at Elliott Ranch - Willow
- Plan 2280 at Elliott Ranch - Sage