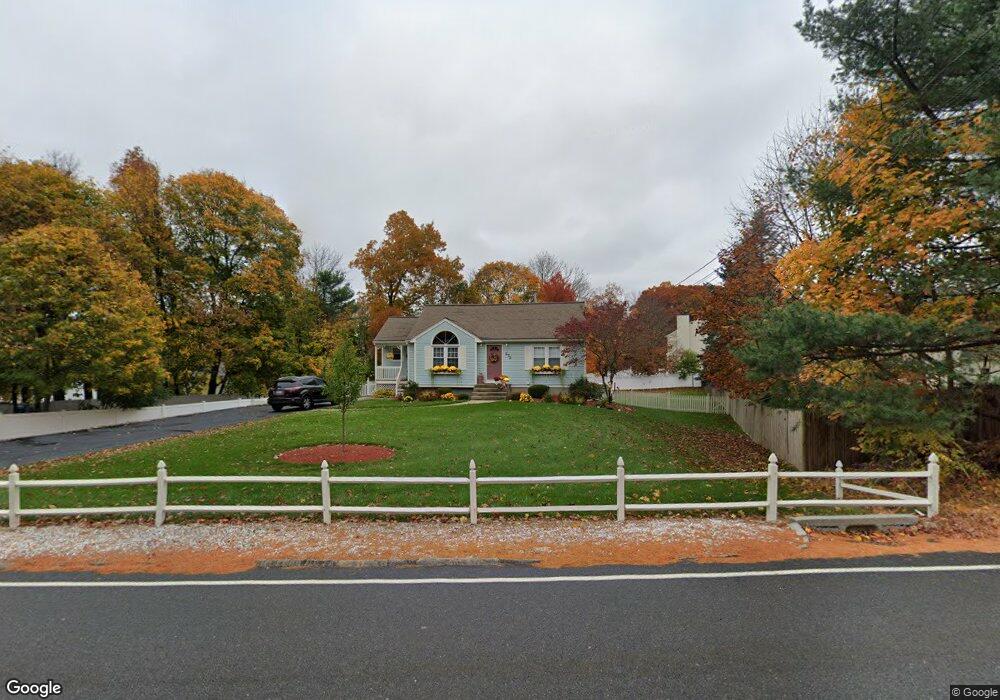
675 Oak St Franklin, MA 02038
Estimated Value: $569,000 - $731,000
2
Beds
2
Baths
1,048
Sq Ft
$597/Sq Ft
Est. Value
About This Home
This home is located at 675 Oak St, Franklin, MA 02038 and is currently estimated at $626,176, approximately $597 per square foot. 675 Oak St is a home located in Norfolk County with nearby schools including Oak Street Elementary School, Horace Mann Middle School, and Franklin High School.
Ownership History
Date
Name
Owned For
Owner Type
Purchase Details
Closed on
Nov 18, 1996
Sold by
Davis Beverly A
Bought by
Iodice John F
Current Estimated Value
Home Financials for this Owner
Home Financials are based on the most recent Mortgage that was taken out on this home.
Original Mortgage
$133,589
Interest Rate
7.99%
Mortgage Type
Purchase Money Mortgage
Create a Home Valuation Report for This Property
The Home Valuation Report is an in-depth analysis detailing your home's value as well as a comparison with similar homes in the area
Purchase History
| Date | Buyer | Sale Price | Title Company |
|---|---|---|---|
| Iodice John F | $135,000 | -- |
Source: Public Records
Mortgage History
| Date | Status | Borrower | Loan Amount |
|---|---|---|---|
| Open | Iodice John F | $230,000 | |
| Closed | Iodice John F | $131,600 | |
| Closed | Iodice John F | $133,589 |
Source: Public Records
Tax History
| Year | Tax Paid | Tax Assessment Tax Assessment Total Assessment is a certain percentage of the fair market value that is determined by local assessors to be the total taxable value of land and additions on the property. | Land | Improvement |
|---|---|---|---|---|
| 2025 | $6,741 | $580,100 | $237,800 | $342,300 |
| 2024 | $6,439 | $546,100 | $237,800 | $308,300 |
| 2023 | $6,651 | $528,700 | $259,600 | $269,100 |
| 2022 | $6,123 | $435,800 | $198,200 | $237,600 |
| 2021 | $5,998 | $409,400 | $206,400 | $203,000 |
| 2020 | $5,824 | $401,400 | $208,200 | $193,200 |
| 2019 | $5,509 | $375,800 | $182,600 | $193,200 |
| 2018 | $5,271 | $359,800 | $186,300 | $173,500 |
| 2017 | $5,192 | $356,100 | $182,600 | $173,500 |
| 2016 | $5,249 | $362,000 | $189,500 | $172,500 |
| 2015 | $5,102 | $343,800 | $171,300 | $172,500 |
| 2014 | $4,896 | $338,800 | $166,300 | $172,500 |
Source: Public Records
Map
Nearby Homes
- 276 Pond St
- 34 Schofield Dr
- 8 Riverstone Way
- 25 Brookview Rd
- 214 Conlyn Ave
- 1801 Franklin Crossing Rd Unit 1801
- 41 Kimberlee Ave
- 602 Franklin Crossing Rd Unit 602
- 78 Highwood Dr
- 6 Lydia Ln
- 834-836 W Central St
- 6 Pine Knoll Rd
- 27 Dover Cir
- 29 Hancock Rd
- 70 Oak St
- 17 Pine St
- 48 Dover Cir
- 60 Pine St
- 204 Lincoln St
- 14 Pleasant St Unit B
Your Personal Tour Guide
Ask me questions while you tour the home.