Estimated Value: $465,156 - $597,000
3
Beds
2
Baths
1,547
Sq Ft
$338/Sq Ft
Est. Value
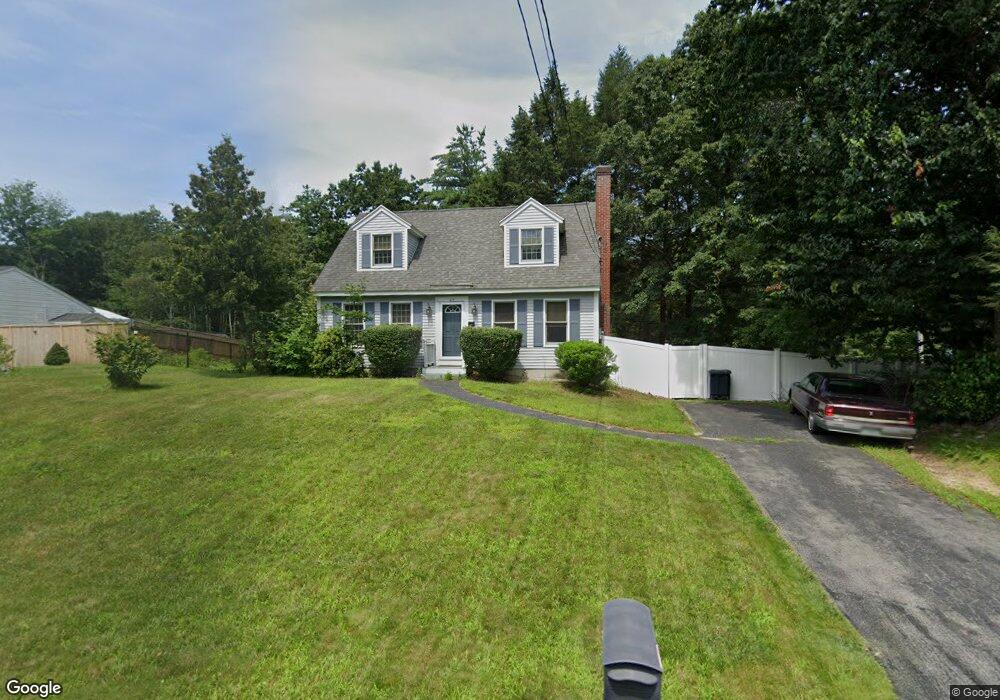
About This Home
This home is located at 69 Overledge Drive Extension, Derry, NH 03038 and is currently estimated at $522,289, approximately $337 per square foot. 69 Overledge Drive Extension is a home located in Rockingham County with nearby schools including Ernest P. Barka Elementary School, Gilbert H. Hood Middle School, and Pinkerton Academy.
Ownership History
Date
Name
Owned For
Owner Type
Purchase Details
Closed on
Oct 20, 2008
Sold by
Panciocco Robert
Bought by
Morrissey John and Morrissey Krysten
Current Estimated Value
Home Financials for this Owner
Home Financials are based on the most recent Mortgage that was taken out on this home.
Original Mortgage
$226,000
Outstanding Balance
$147,042
Interest Rate
6.41%
Mortgage Type
Purchase Money Mortgage
Estimated Equity
$375,247
Purchase Details
Closed on
Apr 22, 2008
Sold by
Mcdermott Ryan and Mcdermott Fhlmc
Bought by
Fhlmc
Purchase Details
Closed on
Nov 26, 2003
Sold by
Cioli Jeffrey J and Cioli Lynda D
Bought by
Mcdermott Ryan
Home Financials for this Owner
Home Financials are based on the most recent Mortgage that was taken out on this home.
Original Mortgage
$260,938
Interest Rate
6.09%
Mortgage Type
Purchase Money Mortgage
Create a Home Valuation Report for This Property
The Home Valuation Report is an in-depth analysis detailing your home's value as well as a comparison with similar homes in the area
Home Values in the Area
Average Home Value in this Area
Purchase History
| Date | Buyer | Sale Price | Title Company |
|---|---|---|---|
| Morrissey John | $238,000 | -- | |
| Fhlmc | $167,900 | -- | |
| Mcdermott Ryan | $263,000 | -- |
Source: Public Records
Mortgage History
| Date | Status | Borrower | Loan Amount |
|---|---|---|---|
| Open | Mcdermott Ryan | $226,000 | |
| Previous Owner | Mcdermott Ryan | $256,000 | |
| Previous Owner | Mcdermott Ryan | $61,000 | |
| Previous Owner | Mcdermott Ryan | $260,938 |
Source: Public Records
Tax History
| Year | Tax Paid | Tax Assessment Tax Assessment Total Assessment is a certain percentage of the fair market value that is determined by local assessors to be the total taxable value of land and additions on the property. | Land | Improvement |
|---|---|---|---|---|
| 2025 | $9,787 | $515,400 | $0 | $515,400 |
| 2024 | $9,633 | $515,400 | $0 | $515,400 |
| 2023 | $9,112 | $440,600 | $0 | $440,600 |
| 2022 | $8,389 | $440,600 | $0 | $440,600 |
| 2021 | $7,889 | $318,600 | $0 | $318,600 |
| 2020 | $7,755 | $318,600 | $0 | $318,600 |
| 2019 | $6,964 | $266,600 | $87,900 | $178,700 |
| 2018 | $6,836 | $266,600 | $87,900 | $178,700 |
| 2017 | $6,294 | $229,700 | $83,300 | $146,400 |
| 2016 | $6,216 | $229,700 | $83,300 | $146,400 |
| 2015 | $6,059 | $207,300 | $83,300 | $124,000 |
| 2014 | $6,099 | $207,300 | $83,300 | $124,000 |
| 2013 | $6,056 | $192,300 | $78,600 | $113,700 |
Source: Public Records
Map
Nearby Homes
- 67 Overledge Drive Extension
- 71 Overledge Drive Extension
- 70 Overledge Drive Extension
- 65 Overledge Drive Extension
- 75 Overledge Drive Extension
- 74 Overledge Drive Extension
- 72 Overledge Dr Extension
- 72 Overledge Drive Extension
- 68 Overledge Drive Extension
- 77 Overledge Drive Extension
- 76 Overledge Drive Extension
- 66 Overledge Drive Extension
- 79 Overledge Drive Extension
- 78 Overledge Drive Extension
- 78 Overledge Dr
- 80 Overledge Drive Extension
- 81 Overledge Drive Extension
- 82 Overledge Drive Extension
- 83 Overledge Drive Extension
- 84 Overledge Drive Extension
Your Personal Tour Guide
Ask me questions while you tour the home.