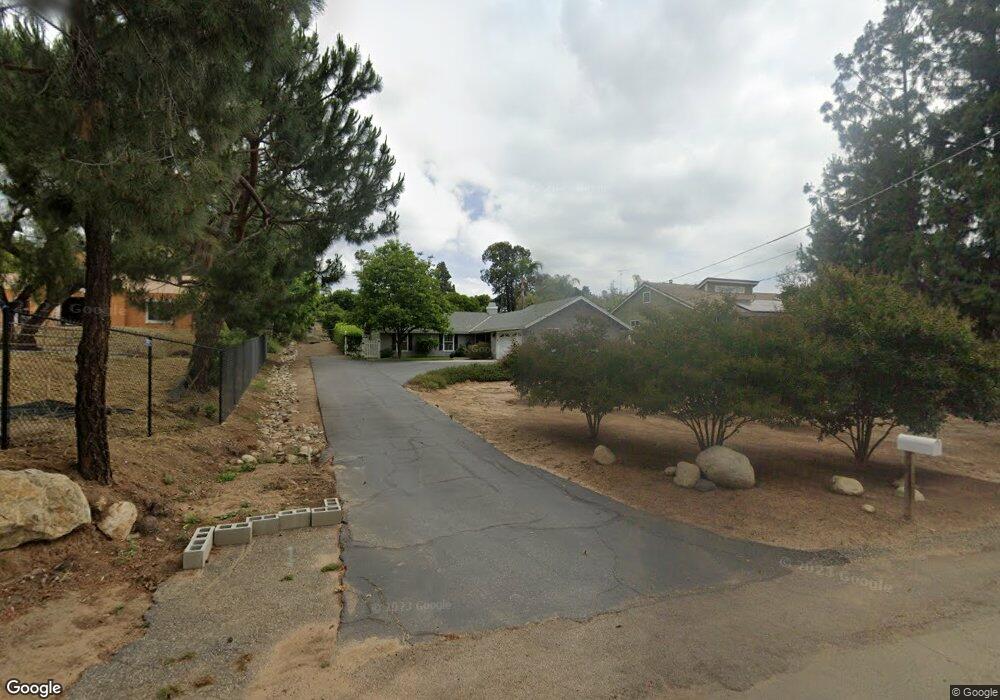
705 Carnation Ln Fallbrook, CA 92028
Estimated Value: $732,000 - $821,000
3
Beds
2
Baths
1,520
Sq Ft
$505/Sq Ft
Est. Value
About This Home
This home is located at 705 Carnation Ln, Fallbrook, CA 92028 and is currently estimated at $768,248, approximately $505 per square foot. 705 Carnation Ln is a home located in San Diego County with nearby schools including La Paloma Elementary School, James E. Potter Intermediate School, and Fallbrook High School.
Ownership History
Date
Name
Owned For
Owner Type
Purchase Details
Closed on
Dec 19, 2005
Sold by
Allegro Daniel Ross and Allegro Connie L
Bought by
Allegro Daniel R and Allegro Connie L
Current Estimated Value
Purchase Details
Closed on
Feb 1, 1999
Sold by
Pearson Gary and Pearson Sheilah
Bought by
Allegro Daniel Ross and Allegro Connie L
Home Financials for this Owner
Home Financials are based on the most recent Mortgage that was taken out on this home.
Original Mortgage
$180,000
Outstanding Balance
$42,678
Interest Rate
6.76%
Estimated Equity
$725,570
Purchase Details
Closed on
Oct 18, 1988
Purchase Details
Closed on
Jan 12, 1988
Purchase Details
Closed on
Oct 15, 1987
Purchase Details
Closed on
Aug 26, 1985
Create a Home Valuation Report for This Property
The Home Valuation Report is an in-depth analysis detailing your home's value as well as a comparison with similar homes in the area
Home Values in the Area
Average Home Value in this Area
Purchase History
| Date | Buyer | Sale Price | Title Company |
|---|---|---|---|
| Allegro Daniel R | -- | None Available | |
| Allegro Daniel R | -- | None Available | |
| Allegro Daniel Ross | $200,000 | Lawyers Title | |
| -- | $160,000 | -- | |
| -- | $35,000 | -- | |
| -- | $35,000 | -- | |
| -- | $35,200 | -- |
Source: Public Records
Mortgage History
| Date | Status | Borrower | Loan Amount |
|---|---|---|---|
| Open | Allegro Daniel Ross | $180,000 |
Source: Public Records
Tax History
| Year | Tax Paid | Tax Assessment Tax Assessment Total Assessment is a certain percentage of the fair market value that is determined by local assessors to be the total taxable value of land and additions on the property. | Land | Improvement |
|---|---|---|---|---|
| 2025 | $3,239 | $313,518 | $137,164 | $176,354 |
| 2024 | $3,239 | $307,372 | $134,475 | $172,897 |
| 2023 | $3,148 | $301,346 | $131,839 | $169,507 |
| 2022 | $3,148 | $295,438 | $129,254 | $166,184 |
| 2021 | $3,046 | $289,646 | $126,720 | $162,926 |
| 2020 | $3,071 | $286,677 | $125,421 | $161,256 |
| 2019 | $3,013 | $281,057 | $122,962 | $158,095 |
| 2018 | $2,966 | $275,547 | $120,551 | $154,996 |
| 2017 | $2,907 | $270,145 | $118,188 | $151,957 |
| 2016 | $2,833 | $264,849 | $115,871 | $148,978 |
| 2015 | $2,780 | $260,872 | $114,131 | $146,741 |
| 2014 | $2,727 | $255,763 | $111,896 | $143,867 |
Source: Public Records
Map
Nearby Homes
- 1024 Kiel Rd
- 206 Via Oro Verde
- 1003 Via Unidos
- 508 Village View Place
- 535 Shady Glen Dr
- 956 Woodcreek Rd
- 903 Crescent Bend
- 832 Magarian Rd
- 522 S Pico Ave
- 1304 Farrand Rd
- 1168 N Crescent Ridge Rd
- 0 Laurine Ln
- 502 E Elder St
- 741 Rossiter Ln
- 210 S Orange Ave
- 445 Poets Square
- 1217 Juliette Place
- 929 Pepper Tree Ln
- 1735 S Mission Rd
- 1265 E Fallbrook St
- 717 Carnation Ln
- 701 Carnation Ln
- 729 Carnation Ln
- 387 Pippin Dr
- 399 Pippin Dr
- 704 Carnation Ln
- 702 Carnation Ln
- 720 Carnation Ln
- 375 Pippin Dr
- 550 Golden Rd
- 737 Carnation Ln
- 398 Pippin Dr
- 732 Carnation Ln
- 363 Pippin Dr
- 351 Pippin Dr
- 386 Pippin Dr
- 1249 Senwood Way
- 743 Carnation Ln
- 329 Pippin Dr
- 1237 Senwood Way
Your Personal Tour Guide
Ask me questions while you tour the home.