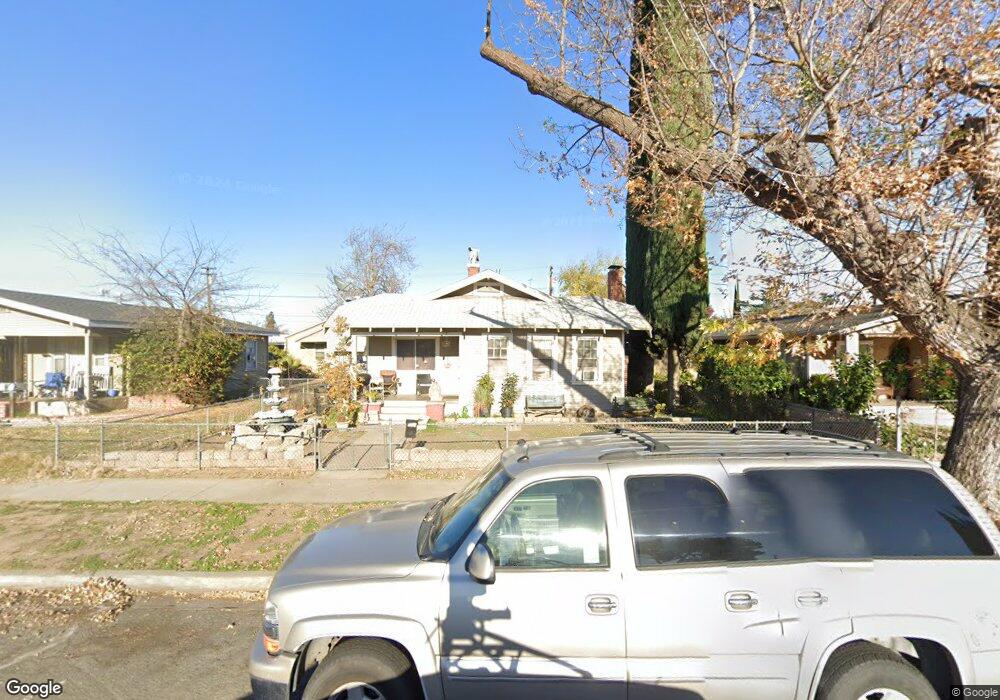
720 3rd St Modesto, CA 95351
Downtown Modesto NeighborhoodEstimated Value: $343,087 - $387,000
2
Beds
1
Bath
1,928
Sq Ft
$191/Sq Ft
Est. Value
About This Home
This home is located at 720 3rd St, Modesto, CA 95351 and is currently estimated at $367,772, approximately $190 per square foot. 720 3rd St is a home located in Stanislaus County with nearby schools including Franklin Elementary School, Mark Twain Junior High School, and Modesto High School.
Ownership History
Date
Name
Owned For
Owner Type
Purchase Details
Closed on
May 28, 2025
Sold by
Arellano Jose A
Bought by
3Kings Llc and Ca Llc
Current Estimated Value
Purchase Details
Closed on
Apr 7, 2025
Sold by
3Kings Llc
Bought by
Arellano Jose A
Purchase Details
Closed on
Feb 1, 2024
Sold by
3Kings Llc
Bought by
Arellano Jose A
Home Financials for this Owner
Home Financials are based on the most recent Mortgage that was taken out on this home.
Original Mortgage
$350,000
Interest Rate
6.61%
Mortgage Type
New Conventional
Purchase Details
Closed on
Jul 14, 2015
Sold by
Alfredo Jose and Arellano Jose Alfredo
Bought by
3Kings Llc
Home Financials for this Owner
Home Financials are based on the most recent Mortgage that was taken out on this home.
Original Mortgage
$302,500
Interest Rate
3.91%
Mortgage Type
Commercial
Purchase Details
Closed on
Jan 10, 2013
Sold by
Garcia Alicia
Bought by
Alfredo Jose
Purchase Details
Closed on
Jun 30, 2011
Sold by
Insixiengmay Bounkhong and The Bounkhong Insixiengmay Liv
Bought by
Garcia Alicia
Purchase Details
Closed on
Apr 20, 2006
Sold by
Insixiengmay Bounkhong
Bought by
The Bounkhong Insixiengmay Living Trust
Purchase Details
Closed on
Nov 7, 2005
Sold by
Coffey Jimmy and Attiya Souriya
Bought by
Insixiengmay Bounkhong
Purchase Details
Closed on
Apr 14, 1999
Sold by
California Equity Management Group Inc
Bought by
Coffey Jimmy and Attiya Souriya
Home Financials for this Owner
Home Financials are based on the most recent Mortgage that was taken out on this home.
Original Mortgage
$83,313
Interest Rate
7.1%
Mortgage Type
FHA
Purchase Details
Closed on
Oct 29, 1998
Sold by
Ocwen Federal Bank Fsb
Bought by
California Equity Management Group Inc
Purchase Details
Closed on
Aug 27, 1998
Sold by
Daniels Deborah Louise Matney
Bought by
Ocwen Federal Bank Fsb
Create a Home Valuation Report for This Property
The Home Valuation Report is an in-depth analysis detailing your home's value as well as a comparison with similar homes in the area
Home Values in the Area
Average Home Value in this Area
Purchase History
| Date | Buyer | Sale Price | Title Company |
|---|---|---|---|
| 3Kings Llc | -- | None Listed On Document | |
| Arellano Jose A | -- | None Listed On Document | |
| Arellano Jose A | -- | None Listed On Document | |
| Arellano Jose A | -- | None Listed On Document | |
| 3Kings Llc | -- | None Listed On Document | |
| Arellano Jose A | -- | None Listed On Document | |
| Arellano Jose A | -- | None Listed On Document | |
| 3Kings Llc | -- | None Available | |
| Alfredo Jose | $53,500 | None Available | |
| Garcia Alicia | $53,500 | Fidelity National Title Co | |
| The Bounkhong Insixiengmay Living Trust | -- | None Available | |
| Insixiengmay Bounkhong | -- | -- | |
| Coffey Jimmy | $84,000 | Chicago Title Co | |
| California Equity Management Group Inc | $37,000 | Chicago Title Co | |
| Ocwen Federal Bank Fsb | $55,000 | Fidelity National Title |
Source: Public Records
Mortgage History
| Date | Status | Borrower | Loan Amount |
|---|---|---|---|
| Previous Owner | Arellano Jose A | $350,000 | |
| Previous Owner | 3Kings Llc | $302,500 | |
| Previous Owner | Coffey Jimmy | $83,313 |
Source: Public Records
Tax History
| Year | Tax Paid | Tax Assessment Tax Assessment Total Assessment is a certain percentage of the fair market value that is determined by local assessors to be the total taxable value of land and additions on the property. | Land | Improvement |
|---|---|---|---|---|
| 2025 | $770 | $65,871 | $18,468 | $47,403 |
| 2024 | $736 | $64,580 | $18,106 | $46,474 |
| 2023 | $725 | $63,314 | $17,751 | $45,563 |
| 2022 | $707 | $62,073 | $17,403 | $44,670 |
| 2021 | $665 | $60,857 | $17,062 | $43,795 |
| 2020 | $678 | $60,234 | $16,888 | $43,346 |
| 2019 | $663 | $59,054 | $16,557 | $42,497 |
| 2018 | $631 | $57,897 | $16,233 | $41,664 |
| 2017 | $616 | $56,763 | $15,915 | $40,848 |
| 2016 | $604 | $55,651 | $15,603 | $40,048 |
| 2015 | $397 | $36,507 | $15,989 | $20,518 |
| 2014 | $391 | $35,793 | $15,676 | $20,117 |
Source: Public Records
Map
Nearby Homes
Your Personal Tour Guide
Ask me questions while you tour the home.