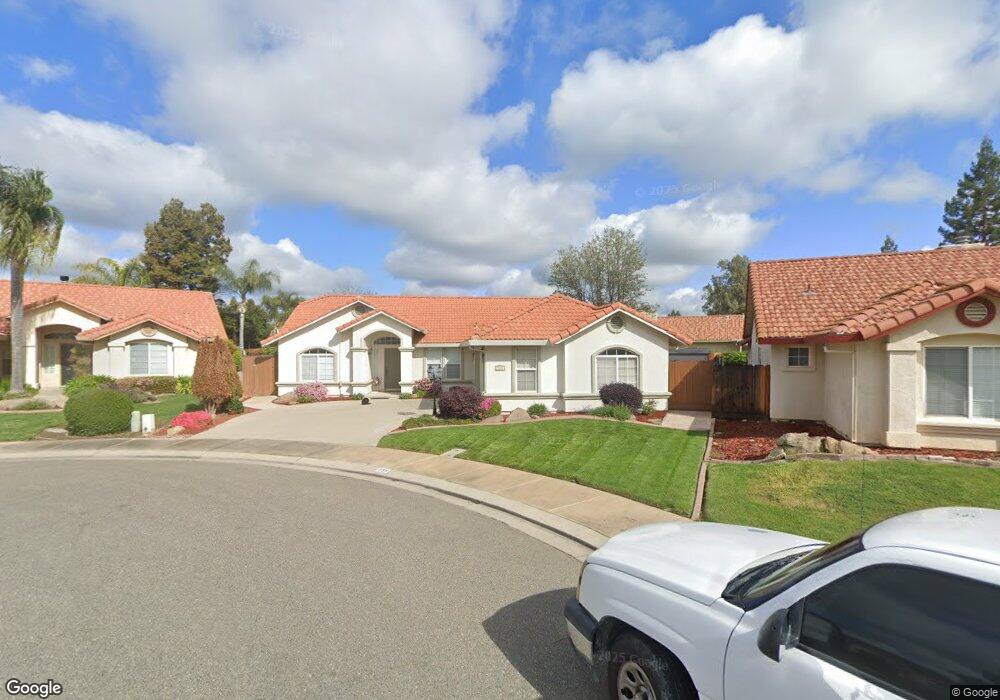
735 Nighthawk Ct Merced, CA 95340
North Merced NeighborhoodEstimated Value: $419,000 - $471,000
3
Beds
2
Baths
1,600
Sq Ft
$280/Sq Ft
Est. Value
About This Home
This home is located at 735 Nighthawk Ct, Merced, CA 95340 and is currently estimated at $447,210, approximately $279 per square foot. 735 Nighthawk Ct is a home located in Merced County with nearby schools including Allan Peterson Elementary School, Herbert H. Cruickshank Middle School, and El Capitan High School.
Ownership History
Date
Name
Owned For
Owner Type
Purchase Details
Closed on
Apr 19, 2022
Sold by
Marquez Tanya L
Bought by
Tanya L Marquez Living Trust and Marquez
Current Estimated Value
Purchase Details
Closed on
Aug 26, 2002
Sold by
Hill Jeremy A and Hill Leah P
Bought by
Marquez Tanya L
Home Financials for this Owner
Home Financials are based on the most recent Mortgage that was taken out on this home.
Original Mortgage
$176,000
Interest Rate
6.24%
Purchase Details
Closed on
Dec 9, 1998
Sold by
Y B Real Estate Inc
Bought by
Hill Jeremy A and Hill Leah P
Home Financials for this Owner
Home Financials are based on the most recent Mortgage that was taken out on this home.
Original Mortgage
$128,477
Interest Rate
6.84%
Mortgage Type
FHA
Create a Home Valuation Report for This Property
The Home Valuation Report is an in-depth analysis detailing your home's value as well as a comparison with similar homes in the area
Home Values in the Area
Average Home Value in this Area
Purchase History
| Date | Buyer | Sale Price | Title Company |
|---|---|---|---|
| Tanya L Marquez Living Trust | -- | Richardson Julie | |
| Marquez Tanya L | $220,000 | Chicago Title Company | |
| Hill Jeremy A | $130,000 | Chicago Title Co |
Source: Public Records
Mortgage History
| Date | Status | Borrower | Loan Amount |
|---|---|---|---|
| Previous Owner | Marquez Tanya L | $176,000 | |
| Previous Owner | Hill Jeremy A | $128,477 | |
| Closed | Hill Jeremy A | $6,423 | |
| Closed | Marquez Tanya L | $22,000 |
Source: Public Records
Tax History
| Year | Tax Paid | Tax Assessment Tax Assessment Total Assessment is a certain percentage of the fair market value that is determined by local assessors to be the total taxable value of land and additions on the property. | Land | Improvement |
|---|---|---|---|---|
| 2025 | $3,473 | $321,544 | $65,166 | $256,378 |
| 2024 | $3,473 | $315,240 | $63,889 | $251,351 |
| 2023 | $3,415 | $309,060 | $62,637 | $246,423 |
| 2022 | $3,363 | $303,001 | $61,409 | $241,592 |
| 2021 | $3,348 | $297,060 | $60,205 | $236,855 |
| 2020 | $3,361 | $294,015 | $59,588 | $234,427 |
| 2019 | $3,309 | $288,251 | $58,420 | $229,831 |
| 2018 | $2,819 | $263,000 | $55,000 | $208,000 |
| 2017 | $2,813 | $248,500 | $45,000 | $203,500 |
| 2016 | $2,804 | $247,000 | $45,000 | $202,000 |
| 2015 | $2,664 | $236,000 | $45,000 | $191,000 |
| 2014 | $2,051 | $180,000 | $30,000 | $150,000 |
Source: Public Records
Map
Nearby Homes
- 724 Robin Dr
- 3947 Finch Ct
- 3877 Pintail Ct
- 3882 Pintail Ct
- 591 Bobolink Ct Unit 2
- 3951 Black Hawk Ct
- 1126 Sprig Ct
- 0 Dunn Rd Unit MC25278439
- 0 Dunn Rd Unit MC25278437
- 945 Gazelle Ct
- 1463 Hunters Dr
- 692 Gateway Cir
- 1143 Brownie Ct
- 3692 N Gardner Ave
- 3514 Oakhurst Ave
- 1862 Dunn Rd
- 4254 Berryesa Ave
- 4244 Rutherford Ave
- 165 Sullivan Dr
- 1276 Panorama Point Ct
- 749 Nighthawk Ct
- 723 Nighthawk Ct
- 734 Robin Dr
- 744 Robin Dr
- 698 Kingfisher Ct
- 754 Robin Dr
- 3929 Robin Ct
- 734 Nighthawk Ct
- 748 Nighthawk Ct
- 687 Kingfisher Ct
- 684 Kingfisher Ct
- 765 Nighthawk Ct
- 754 Nighthawk Ct
- 764 Robin Dr
- 3939 Robin Ct
- 3944 Robin Ct
- 731 Wren Ct
- 768 Nighthawk Ct
- 689 Mockingbird Ct
- 773 Nighthawk Ct
Your Personal Tour Guide
Ask me questions while you tour the home.