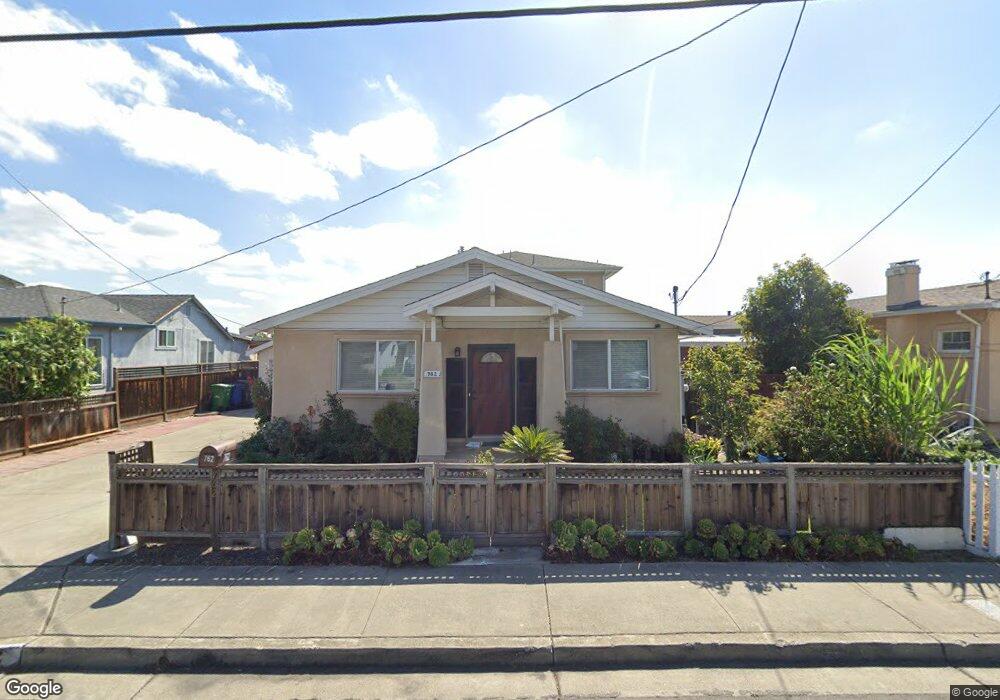
762 Folsom Ave Hayward, CA 94544
Tennyson-Alquire NeighborhoodEstimated Value: $815,000 - $1,125,522
4
Beds
3
Baths
2,126
Sq Ft
$477/Sq Ft
Est. Value
About This Home
This home is located at 762 Folsom Ave, Hayward, CA 94544 and is currently estimated at $1,014,131, approximately $477 per square foot. 762 Folsom Ave is a home located in Alameda County with nearby schools including Palma Ceia Elementary School, Anthony W. Ochoa Middle School, and Mt. Eden High School.
Ownership History
Date
Name
Owned For
Owner Type
Purchase Details
Closed on
Jan 18, 2022
Sold by
Trang Quach
Bought by
Quach Trang
Current Estimated Value
Home Financials for this Owner
Home Financials are based on the most recent Mortgage that was taken out on this home.
Original Mortgage
$620,000
Outstanding Balance
$575,608
Interest Rate
3.69%
Mortgage Type
New Conventional
Estimated Equity
$438,523
Purchase Details
Closed on
Jun 24, 2012
Sold by
Hyman Daniel H
Bought by
Quach Trang and Nguyen Hai
Home Financials for this Owner
Home Financials are based on the most recent Mortgage that was taken out on this home.
Original Mortgage
$387,845
Interest Rate
3.62%
Mortgage Type
FHA
Purchase Details
Closed on
Jan 11, 2012
Sold by
Broadview Estates Llc
Bought by
Hyman Daniel H
Purchase Details
Closed on
Dec 9, 2011
Sold by
Griffin Elbert D and Griffin Diamelys
Bought by
Broadview Estates Llc
Purchase Details
Closed on
Apr 24, 2001
Sold by
Mclaughlin Robert A and Mclaughlin Sally A
Bought by
Griffin Elbert D and Griffin Diamelys
Home Financials for this Owner
Home Financials are based on the most recent Mortgage that was taken out on this home.
Original Mortgage
$155,558
Interest Rate
6.98%
Mortgage Type
FHA
Create a Home Valuation Report for This Property
The Home Valuation Report is an in-depth analysis detailing your home's value as well as a comparison with similar homes in the area
Home Values in the Area
Average Home Value in this Area
Purchase History
| Date | Buyer | Sale Price | Title Company |
|---|---|---|---|
| Quach Trang | $310,000 | Fidelity National Title | |
| Quach Trang | $400,000 | Chicago Title Company | |
| Hyman Daniel H | $225,000 | Old Republic Title Company C | |
| Broadview Estates Llc | $163,910 | None Available | |
| Griffin Elbert D | $158,000 | Placer Title Company |
Source: Public Records
Mortgage History
| Date | Status | Borrower | Loan Amount |
|---|---|---|---|
| Open | Quach Trang | $620,000 | |
| Previous Owner | Quach Trang | $387,845 | |
| Previous Owner | Griffin Elbert D | $155,558 |
Source: Public Records
Tax History Compared to Growth
Tax History
| Year | Tax Paid | Tax Assessment Tax Assessment Total Assessment is a certain percentage of the fair market value that is determined by local assessors to be the total taxable value of land and additions on the property. | Land | Improvement |
|---|---|---|---|---|
| 2025 | $9,669 | $800,327 | $240,098 | $560,229 |
| 2024 | $9,669 | $784,638 | $235,391 | $549,247 |
| 2023 | $9,525 | $769,254 | $230,776 | $538,478 |
| 2022 | $5,739 | $451,345 | $137,503 | $320,842 |
| 2021 | $5,691 | $442,358 | $134,807 | $314,551 |
| 2020 | $5,628 | $444,753 | $133,426 | $311,327 |
| 2019 | $5,672 | $436,035 | $130,810 | $305,225 |
| 2018 | $5,324 | $427,488 | $128,246 | $299,242 |
| 2017 | $5,202 | $419,106 | $125,732 | $293,374 |
| 2016 | $4,902 | $410,890 | $123,267 | $287,623 |
| 2015 | $4,803 | $404,720 | $121,416 | $283,304 |
| 2014 | $4,563 | $396,792 | $119,037 | $277,755 |
Source: Public Records
Map
Nearby Homes
- 878 Folsom Ave
- 29235 Lone Tree Place
- 29223 Whalebone Way Unit 404
- 29255 Harpoon Way
- 933 New England Village Dr
- 552 Celia St
- 1127 Hat Creek Way
- 29043 Windemere Rd
- 1400 Buckingham Way
- 1352 Chelsea Way
- 29288 Chance St
- 29138 Delgado Rd
- 27906 Thackeray Ave
- 41 Astrida Dr Unit 9
- 32 Astrida Dr Unit 2
- 918 W Tennyson Rd Unit 105
- 27949 Thornton Ct Unit 1B
- 28222 Lustig Ct
- 37 Lance Way
- 1439 Almeria Dr